Jun-2026
Sales
Trend
6-Month
Product Count
SKUs
Avg Price
YoY Sales Change
YoY Price Change
Market Insights Snapshot
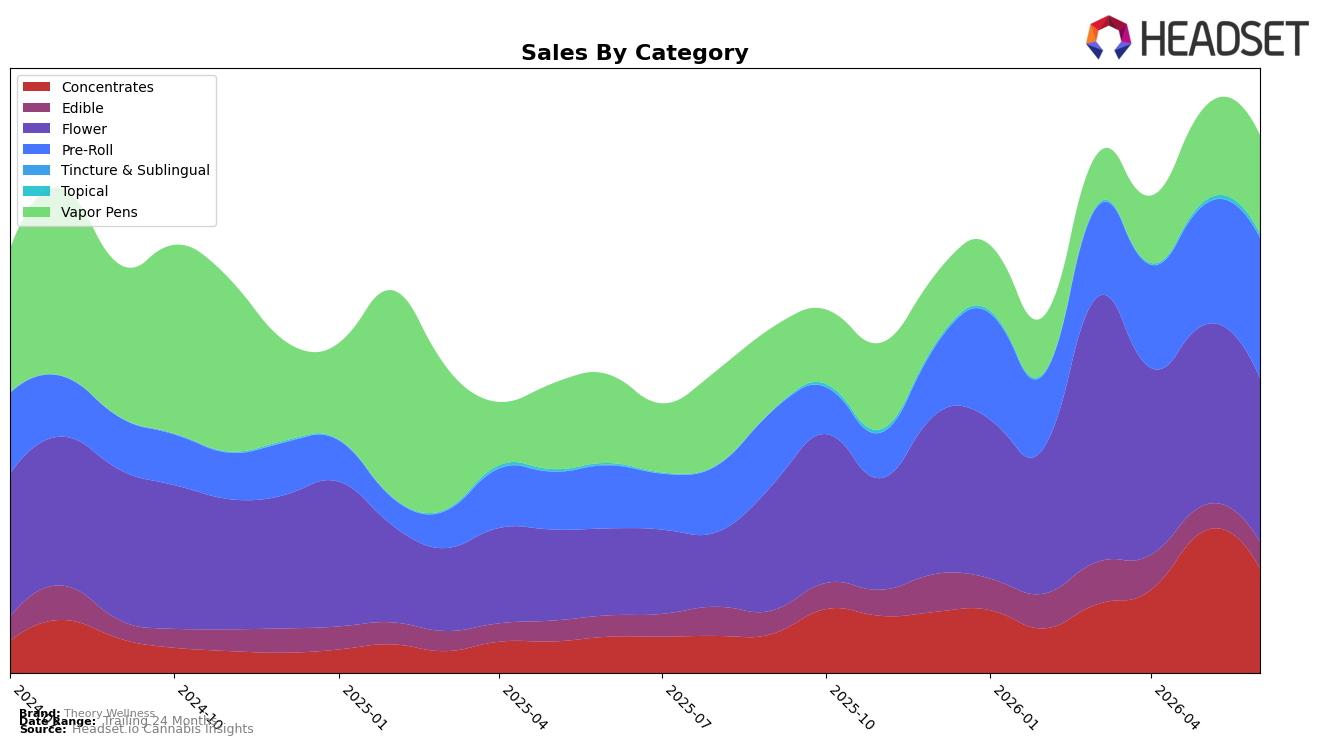
Theory Wellness leaned into core inhalables in June 2026, with Flower at 30.47% share despite a -9.18% month-over-month slide and +88.43% year-over-year growth, while Pre-Roll climbed to 26.14% share on +16.82% MoM and +123.22% YoY. Concentrates held 19.43% share but contracted -26.59% MoM even as they expanded +188.78% YoY, and Vapor Pens at 18.29% share advanced +4.87% MoM with a more modest +11.05% YoY. Smaller formats added ballast: Edible at 4.94% share grew +3.51% MoM and +25.50% YoY, and Topical, though just 0.73% share, surged +26.28% MoM and +190.60% YoY. The net pattern suggests Theory Wellness is balancing a price-led volume strategy (brand-wide average price down 20.23% YoY) to convert YoY gains (+80.68%) into mix stability, even as Flower’s monthly dip shifts near-term momentum toward Pre-Roll and Vapor Pens.
The shifting mix implies a positioning pivot toward accessible, sessionable formats, evidenced by Pre-Roll’s +16.82% MoM growth and Vapor Pens’ +4.87% MoM uptick as Flower retrenched -9.18% MoM, pointing to convenience-led occasions gaining share. The outsized YoY surges in Concentrates (+188.78%) and Topical (+190.60%) alongside a 24-month sales lift of 13.79% and a current Flower rank of 61 in Massachusetts indicate headroom: deep promotional elasticity can win incremental users, but sustained gains likely require improving mid-pack ranking in Flower while protecting Pre-Roll’s 26.14% share. In practice, this mix implies Theory Wellness should anchor traffic with competitively priced Flower while leaning into Pre-Roll and targeted Concentrates drops to translate discount-driven trial into retained share.
Competitive Landscape
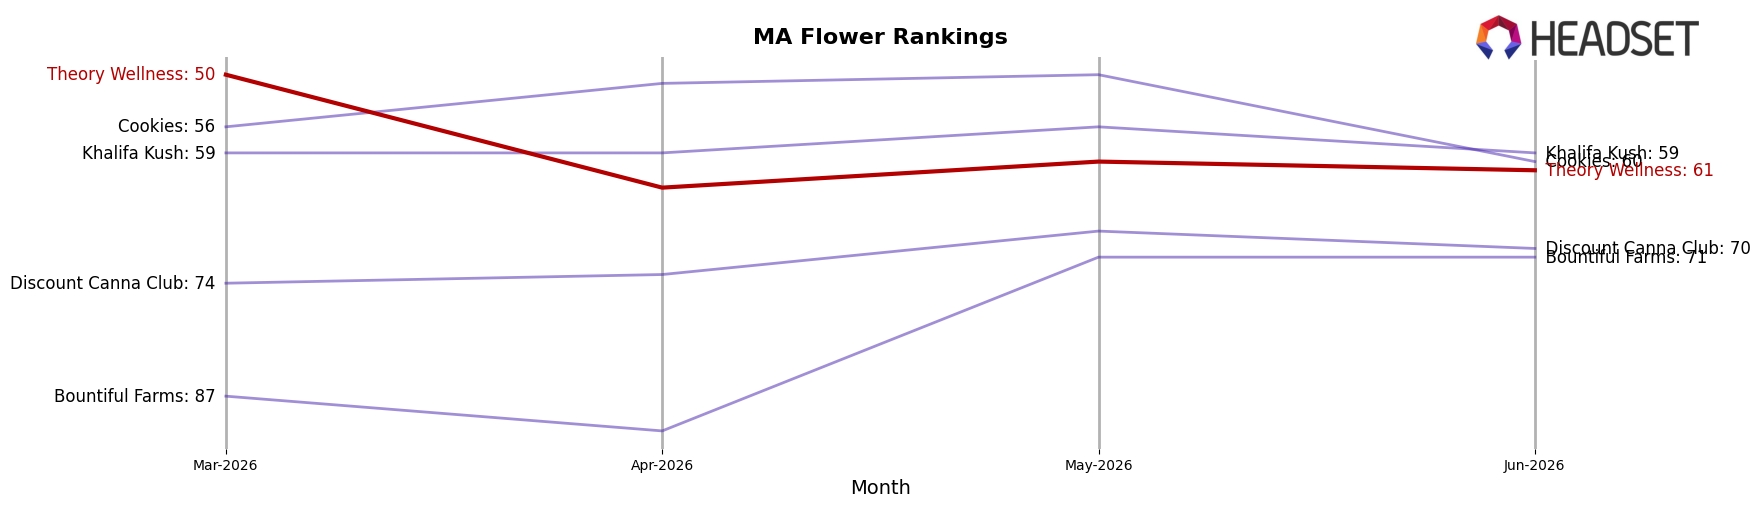
In Massachusetts Flower, Theory Wellness sits at rank #61 in June 2026, a 32-position improvement from #93 year over year, but a slide of 11 places from #50 in March 2026 to #61 by June 2026 indicates mid-year attrition alongside earlier gains; meanwhile, Farmer's Cut moved up two spots from #3 to #1 with a 32.4% YoY sales increase, while Simply Herb eased down one position from #1 to #2 with a 1.6% YoY sales decline, marking a leadership reshuffle that Theory Wellness did not capitalize on. The contrast between Theory Wellness’s YoY climb of 32 ranks and its quarter-to-date fall of 11 ranks, alongside Root & Bloom rising 11 positions from #16 to #5 with 158.9% YoY sales growth, implies that Theory Wellness’s trajectory is improving on an annual horizon but losing relative momentum against accelerating leaders, calling for near-term share defense to avoid further rank erosion.
Notable Products
Gelato Ice Cream Pre-Roll (1g) posted the largest movement in June 2026 with a +99.1% month-over-month jump to rank 2, while Wedding Cake Pre-Roll (0.5g) also surged +64.5% to rank 3, indicating accelerating velocity within the same format; by contrast, the top spot Bernscotti Pre-Roll (1g) inched up just +2.3% at rank 1, implying share consolidation around faster-rising SKUs. With eight of the top ten SKUs in June 2026 in the Pre-Roll category and only two Flower entries at ranks 7 and 9, the lineup is concentrated in convenience formats, and this tilt suggests Theory Wellness is prioritizing quick-turn pre-rolls over whole flower to capture impulse and repeat purchases.
Top Selling Cannabis Brands
Data for this report comes from real-time sales reporting by participating cannabis retailers via their point-of-sale systems, which are linked up with Headset’s business intelligence software. Headset’s data is very reliable, as it comes digitally direct from our partner retailers. However, the potential does exist for misreporting in the instance of duplicates, incorrectly classified products, inaccurate entry of products into point-of-sale systems, or even simple human error at the point of purchase. Thus, there is a slight margin of error to consider. Brands listed on this page are ranked in the top twenty within the market and product category by total retail sales volume.

