.svg)
Sep-2026
Sales
Trend
6-Month
Product Count
SKUs
Avg Price
YoY Sales Change
YoY Price Change


Where to Buy
Play Cannabis is stocked at 216 licensed dispensaries across Michigan, with the deepest coverage in Detroit, New Buffalo, Monroe, Grand Rapids, and Kalamazoo. Search by ZIP code or city below to find the closest one, or filter by product type if you are after a specific format.
Market Insights Snapshot
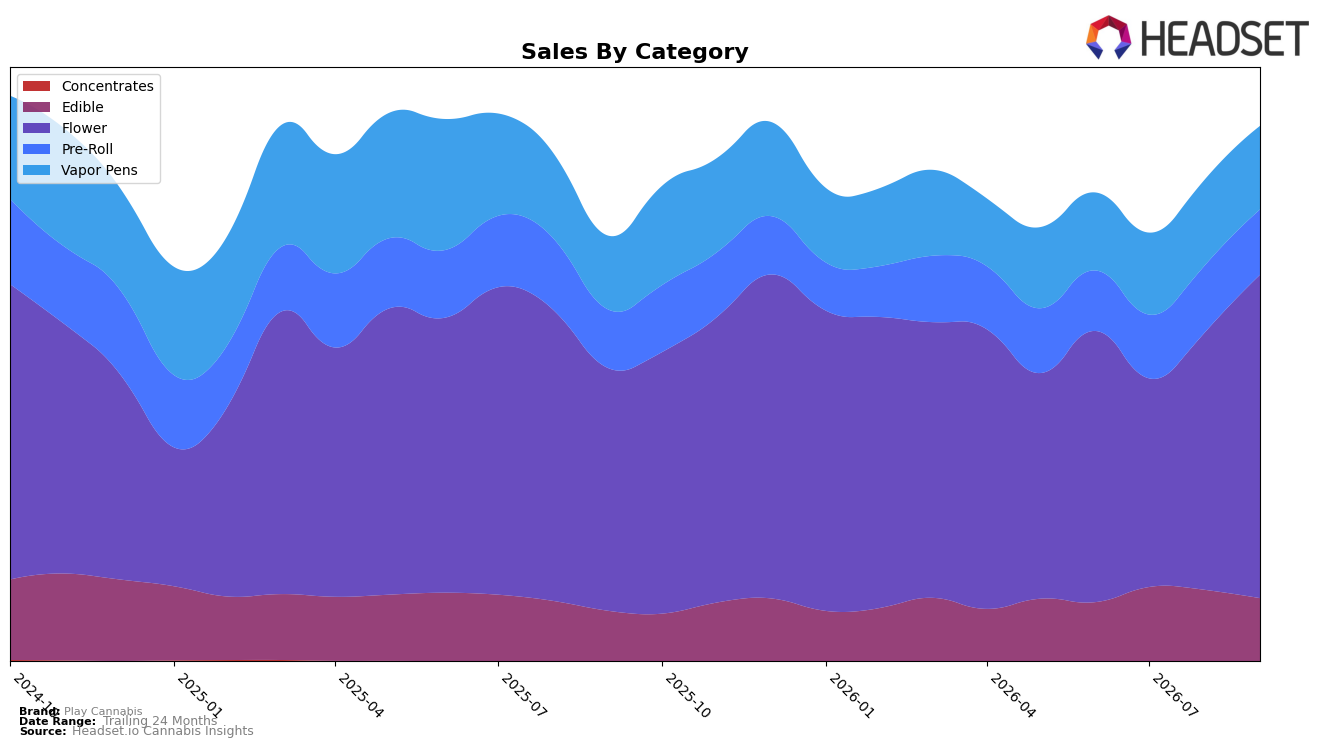
Play Cannabis concentrated 60.50% of September 2026 sales in Flower, up 33.30% year over year and 25.78% month over month, while Edible held 11.74% share with 25.42% YoY growth but an 11.72% MoM decline. Vapor Pens represented 15.59% with 13.18% YoY growth and a 2.78% MoM dip, and Pre-Roll accounted for 12.17% with 11.47% YoY growth and a 2.67% MoM decline. With brand-level sales up 25.87% YoY alongside a 10.99% YoY increase in average price, the mix suggests margin-leaning momentum concentrated in Flower, implying reliance on a single growth engine even as smaller categories cooled in September 2026.
Given Flower’s acceleration and a rank of 2 in Flower in Michigan, the brand’s positioning skews toward high-volume inhalables where recent MoM declines in Vapor Pens (-2.78%) and Pre-Roll (-2.67%) could constrain cross-category traffic. The 24-month sales trend at -1.12% versus September 2026’s +25.87% YoY suggests a near-term rebound anchored by Flower’s 60.50% share rather than diversified category strength, implying the brand’s defensibility depends on sustaining Flower’s double-digit growth while stabilizing Edible’s 11.72% MoM pullback.
Competitive Landscape
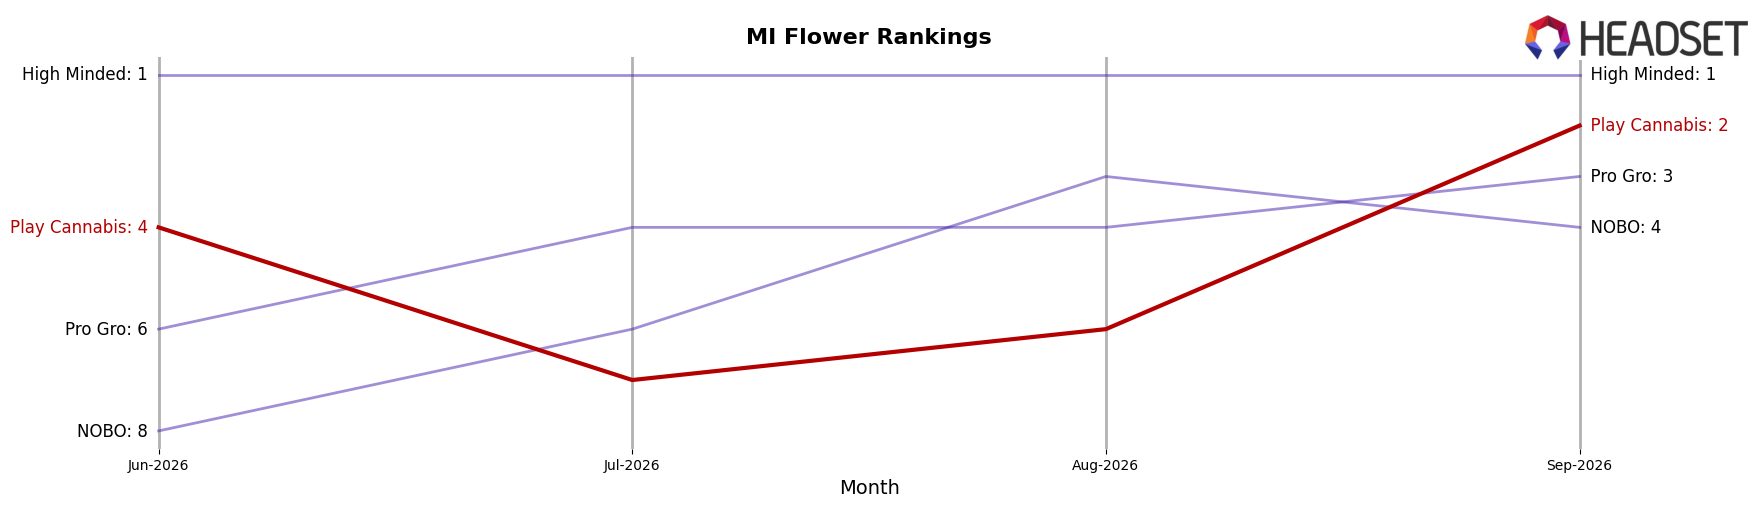
Play Cannabis sits at rank #2 in MI Flower in September 2026 after rising 5 positions year over year from #7, and it moved up 2 spots since June 2026 from #4 to #2, while achieving a new peak rank of #2 in September 2026; in contrast, High Minded held #1 both year over year and currently despite a -3.31% sales change, and Pro Gro advanced from #6 to #3 alongside a +25.54% sales increase, indicating that Play Cannabis’s ascent toward the top is outpacing most peers even as the category’s leader contracts and mid-pack challengers gain share.
Notable Products
Strawberry Hash Rosin Gummies 4-Pack (200mg) posted the steepest pullback at -19.4% MoM while sliding to rank 4, and Berry Burst Gummies 4-Pack (200mg) contracted -11.6% MoM at rank 2, indicating demand cooled for key fruit SKUs even as Cherry Hash Rosin Gummies 4-Pack (200mg) rose 13.6% MoM to hold rank 1. With eight of the top ten coming from Edibles and only one Pre-Roll in the top ten at rank 10, the mix is consolidating around gummies as Watermelon Gummies 4-Pack (200mg) in rank 3 grew 4.5% MoM but Pink Lemonade fell -11.0% at rank 7. The arrival of two Live Rosin gummies without MoM baselines at ranks 6 and 9, plus a lone Pre-Roll generating $56,570 at rank 10, suggests new formats are testing traction while core fruit flavors fragment between gains and double-digit declines. Net, Play Cannabis is leaning into a gummy-led portfolio with selective premium rosin extensions, implying a strategy to defend top ranks via flavor depth while cautiously probing adjacent form factors.
Top Selling Cannabis Brands






Data for this report comes from real-time sales reporting by participating cannabis retailers via their point-of-sale systems, which are linked up with Headset’s business intelligence software. Headset’s data is very reliable, as it comes digitally direct from our partner retailers. However, the potential does exist for misreporting in the instance of duplicates, incorrectly classified products, inaccurate entry of products into point-of-sale systems, or even simple human error at the point of purchase. Thus, there is a slight margin of error to consider. Brands listed on this page are ranked in the top twenty within the market and product category by total retail sales volume.

