.svg)

Sep-2026
Sales
Trend
6-Month
Product Count
SKUs
Avg Price
YoY Sales Change
YoY Price Change


Where to Buy
True North Collective is stocked at 331 licensed dispensaries across Michigan, with the deepest coverage in New Buffalo, Detroit, Monroe, Grand Rapids, and Kalamazoo. Search by ZIP code or city below to find the closest one, or filter by product type if you are after a specific format.
Market Insights Snapshot
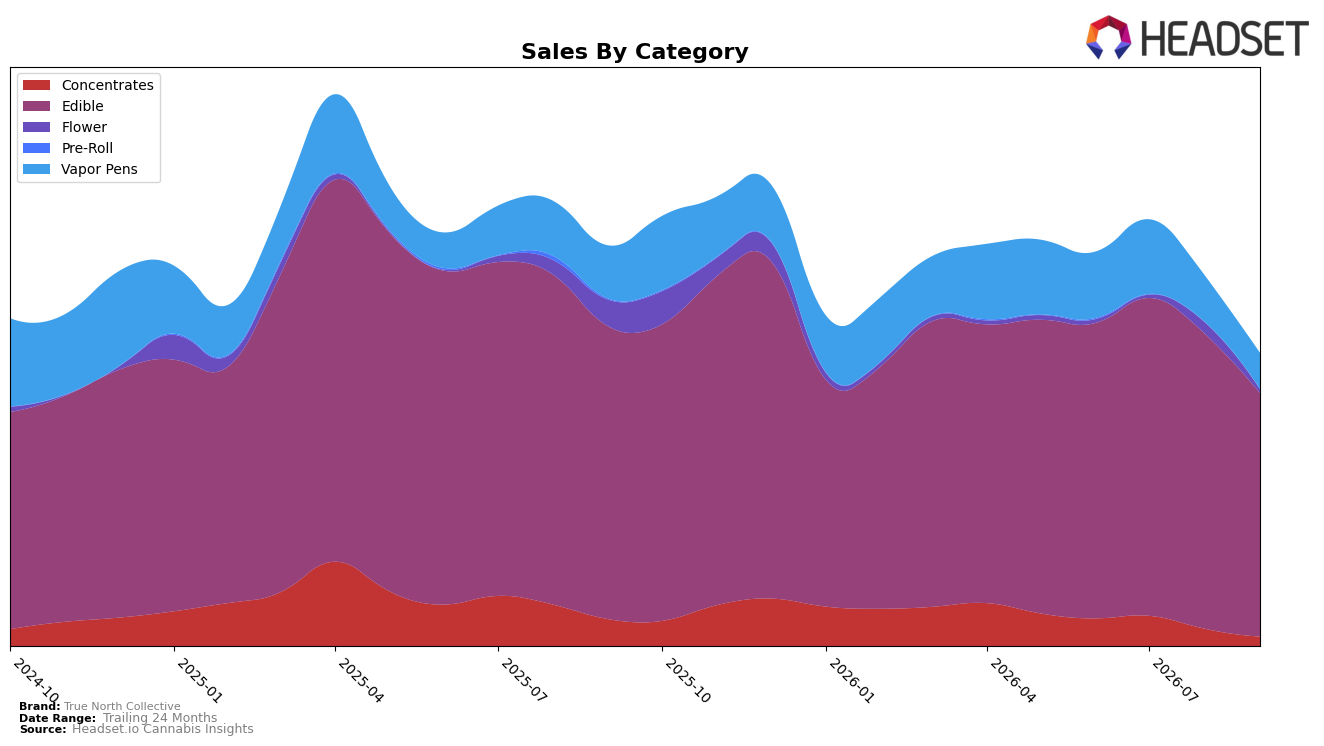
In September 2026, True North Collective concentrated 83.34% of sales in Edible, with Vapor Pens at 12.24%, Concentrates at 3.20%, and Flower at 1.22%. Year over year, Edible declined 16.91% and Vapor Pens fell 32.31%, while Concentrates contracted 65.07% and Flower dropped 86.46%; month over month, Edible slid 17.56% and Vapor Pens decreased 22.72%, with Concentrates down 45.67% and Flower down 67.85%. Average price ticked down 1.26% year over year to one price point across the brand, while Edible’s unit price sat far lower than Vapor Pens and Concentrates, helping preserve volume mix even as total brand sales fell 26.92% year over year. The mix now skews decisively toward value-accessible Edible, implying the brand has leaned into lower-ticket items to defend share amid broad category contractions.
Within Michigan Edible, True North Collective held rank 11, anchoring the portfolio in a mid-pack position while higher-price categories retreated faster; month-over-month drops of 17.56% in Edible versus 22.72% in Vapor Pens indicate relative stability where the brand is already ranked. The 83.34% Edible share paired with a 16.91% Edible year-over-year decline versus a 65.07% decline in Concentrates suggests intentional deprioritization of premium-adjacent formats in favor of scale in Edible. With brand-average pricing down 1.26% year over year and Edible pricing substantially below Vapor Pens, the current pattern implies a defensive, price-sensitive stance optimized for Edible rank maintenance rather than breadth across higher-variance categories.
Competitive Landscape
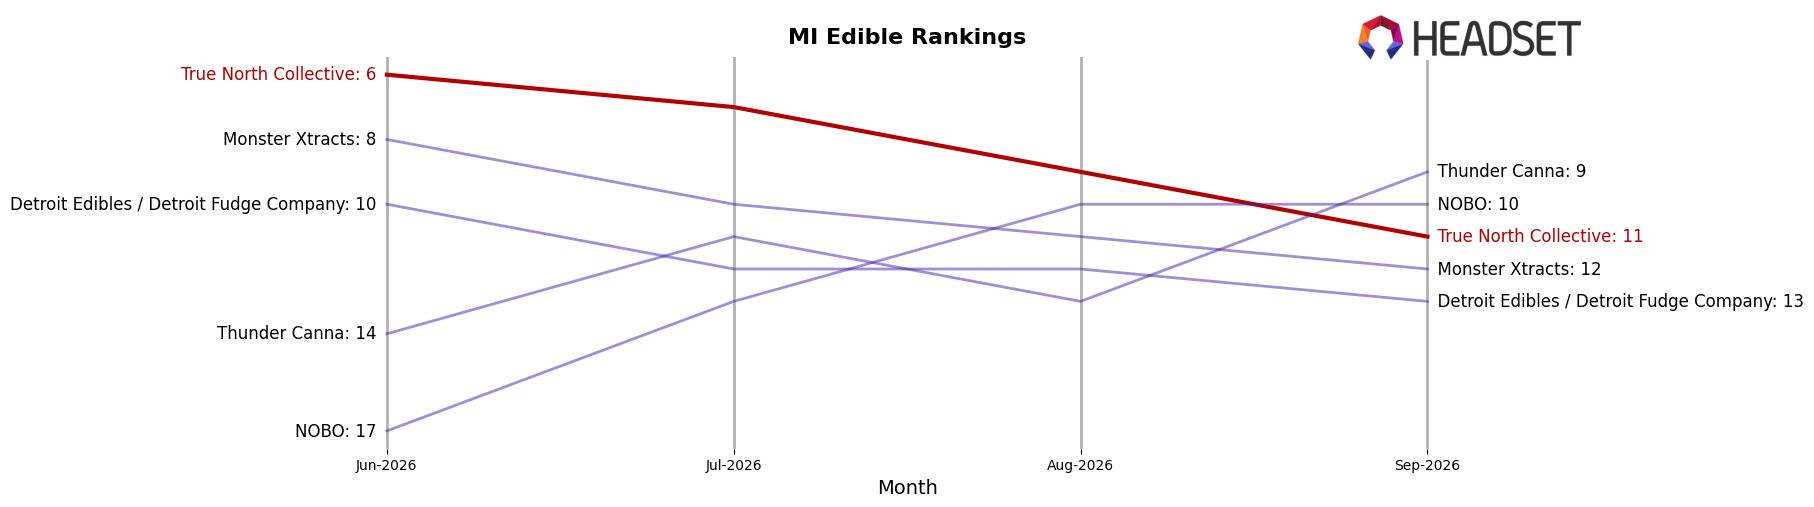
True North Collective sits at rank 11 in MI Edible in September 2026, down 3 positions year over year from rank 8 and 5 positions lower than its June 2026 peak at rank 6; over the last three months it slid from rank 6 to rank 11. In contrast, Wyld held rank 1 both this year and last year while its sales fell 18.3% year over year, and Rocket (MI) climbed from rank 14 to rank 5 alongside a 65.2% year-over-year sales increase. This rank trajectory implies that True North Collective ceded mid-tier share to faster risers despite a stable top tier, and without a reversal toward its June 2026 rank 6 level, further drift out of the top 10 is the base case.
Notable Products
The steepest movement in September 2026 was the One Hitter - Orange Dreamsicle Gummy (200mg) dropping 27.9% MoM to rank 6 while One Hitter - Cherry Limeade Gummy (200mg) fell 21.6% at rank 4, indicating middle-tier erosion even as One Hitter - Blueberry Lemon Haze Gummy (200mg) gained 13.1% to hold rank 1. With four of the top five SKUs posting declines between 9.7% and 27.9% and only one small MoM gainer at rank 7 (+2.9%), the assortment is over-weighted to One Hitter variants that are losing momentum. The concentration is pronounced: nine of the top ten are Edible gummies, and One Hitter SKUs occupy ranks 1 through 6, yet three of those six fell more than 19.6%, pointing to flavor-cycle fatigue rather than category weakness. This pattern implies True North Collective should pivot mix and promo support toward the few flavors with positive or stable MoM while testing new profiles to replace declining One Hitter variants, using the $53,327 leader as the anchor.
Top Selling Cannabis Brands






Data for this report comes from real-time sales reporting by participating cannabis retailers via their point-of-sale systems, which are linked up with Headset’s business intelligence software. Headset’s data is very reliable, as it comes digitally direct from our partner retailers. However, the potential does exist for misreporting in the instance of duplicates, incorrectly classified products, inaccurate entry of products into point-of-sale systems, or even simple human error at the point of purchase. Thus, there is a slight margin of error to consider. Brands listed on this page are ranked in the top twenty within the market and product category by total retail sales volume.

