Jun-2026
Sales
Trend
6-Month
Product Count
SKUs
Avg Price
YoY Sales Change
YoY Price Change
Market Insights Snapshot
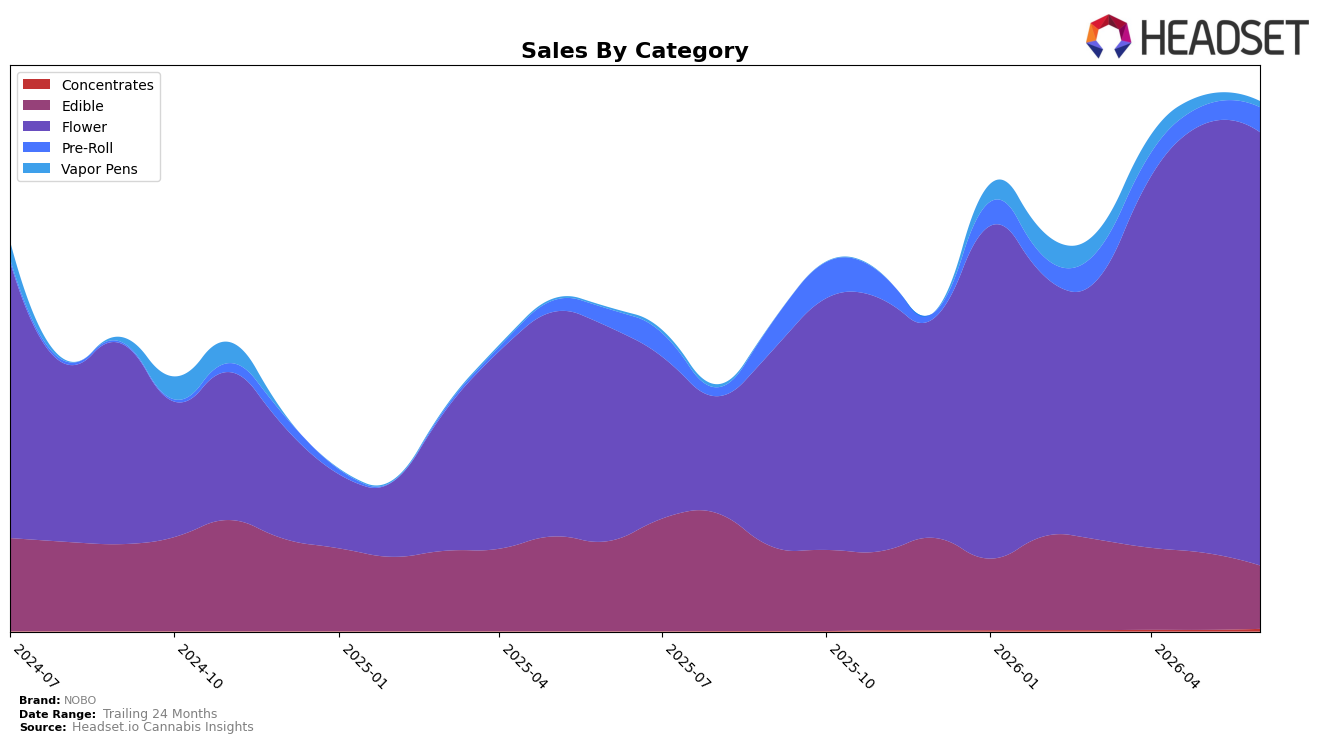
In June 2026, NOBO’s mix concentrated further into Flower at 81.89% share, with Flower sales up 102.28% year over year while month over month grew just 0.96%, signaling a deceleration after a large annual step-up. Edible contracted to 11.92% share with sales down 29.79% year over year and 17.76% month over month, while Pre-Roll expanded to 4.66% share on 40.87% YoY and 34.62% MoM gains, indicating intra-inhalables momentum even as Vapor Pens—only 1.09% share—combined a 312.40% YoY surge with a 41.52% MoM pullback. Concentrates remained a niche at 0.45% share but advanced 75.35% MoM off a small base, and the average price for the brand rose 63.58% YoY alongside the top-state concentration in Michigan and a Flower rank of 7, implying NOBO is leaning into premiumized Flower while trimming breadth in low-velocity formats.
The mix shift implies a positioning anchored in higher-ticket Flower—supported by the 63.58% YoY average price increase and the Flower category’s 102.28% YoY growth—while tactical gains in Pre-Roll (34.62% MoM) provide an on-ramp to value-conscious shoppers without diluting the core. The sharp MoM decline in Vapor Pens (down 41.52%) alongside Edible contraction (down 17.76% MoM) suggests deliberate resource allocation away from formats where price elasticity or shelf churn is higher, whereas the 75.35% MoM rise in Concentrates hints at targeted experimentation that can ladder back to Flower authority and sustain a top-10 Flower position at rank 7.
Competitive Landscape
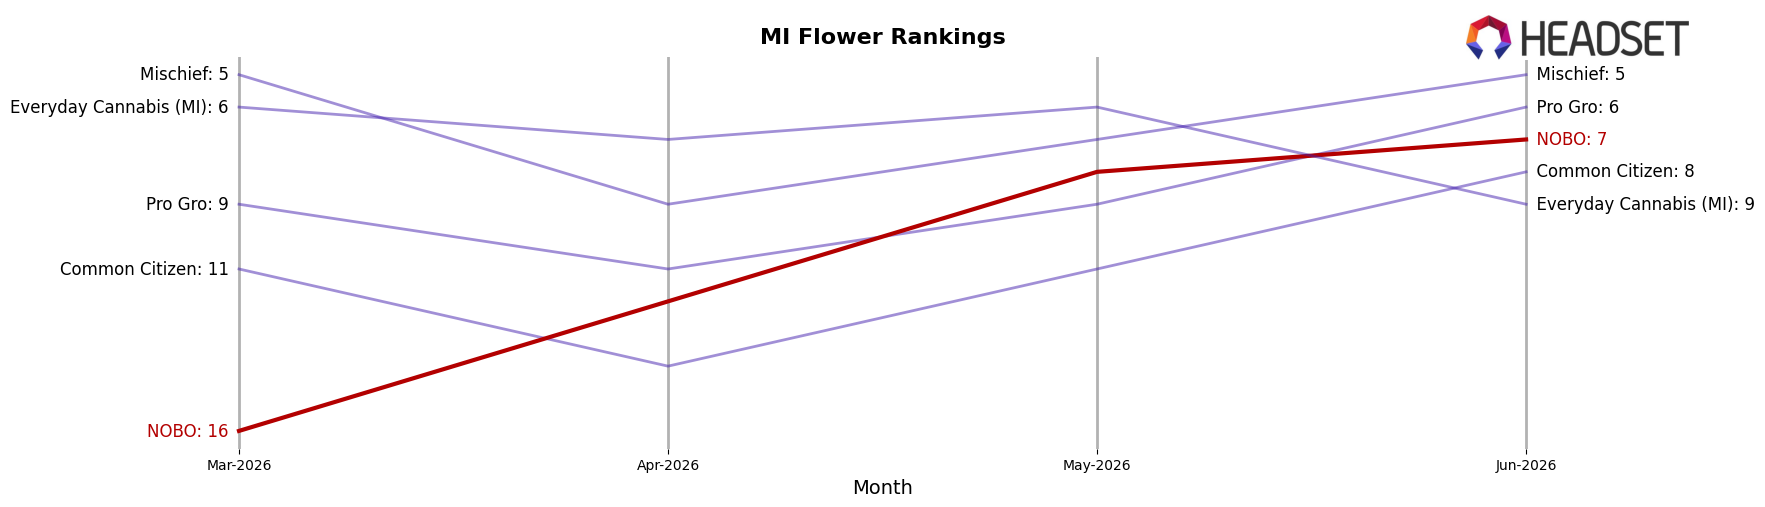
NOBO sits at rank #7 in MI Flower in June 2026, improving 9 positions from #16 year over year, and rising 9 spots versus March 2026 as it moved from #16 to #7. In contrast, Goodlyfe Farms climbed from #5 to #2 with a 44.1% YoY sales increase while High Minded held #1 despite a 13.7% YoY sales decline; meanwhile, Mischief advanced from #13 to #5 alongside a 146.1% YoY sales surge. The combination of NOBO’s rank ascent to a new peak (#7 in June 2026) amid competitors moving up via double-digit growth and even a top-ranked brand contracting indicates NOBO’s trajectory is driven more by share capture from weakening leaders than category expansion, implying near-term upside depends on sustaining relative gains as faster-rising peers compress the gap.
Notable Products
Martian Melon Gummy (200mg) posted the only material month-over-month movement in June 2026 at +11.2% while holding rank 6, whereas Mom's Spaghetti (3.5g) in Flower inched up just +1.7% at rank 9, indicating momentum is concentrated in a single Edible rather than across formats; with Bubblegum Marker (28g) entrenched at rank 1 and the Energy Orange Cream High Dose Gummies 10-Pack (200mg) at rank 4, leadership is split between flagship Flower and high-dose Edibles. Four of the top ten are Edible SKUs and four are Flower, but the absence of any Edible moves over +20% or Flower declines under -10% alongside a $695,284 anchor from Bubblegum Marker (28g) signals stability at the top with only selective upside in mid-tier gummies. This pattern implies NOBO’s commercial direction is tilting toward defending a Flower-led flagship while testing incremental growth in a single Edible lane rather than broad-based product expansion.
Top Selling Cannabis Brands
Data for this report comes from real-time sales reporting by participating cannabis retailers via their point-of-sale systems, which are linked up with Headset’s business intelligence software. Headset’s data is very reliable, as it comes digitally direct from our partner retailers. However, the potential does exist for misreporting in the instance of duplicates, incorrectly classified products, inaccurate entry of products into point-of-sale systems, or even simple human error at the point of purchase. Thus, there is a slight margin of error to consider. Brands listed on this page are ranked in the top twenty within the market and product category by total retail sales volume.

