.svg)

Sep-2026
Sales
Trend
6-Month
Product Count
SKUs
Avg Price
YoY Sales Change
YoY Price Change


Where to Buy
Dirty Arm Farm is stocked at 57 licensed dispensaries across Oregon, with the deepest coverage in Portland, Medford, Eugene, Klamath Falls, and Bend. Search by ZIP code or city below to find the closest one, or filter by product type if you are after a specific format.
Market Insights Snapshot
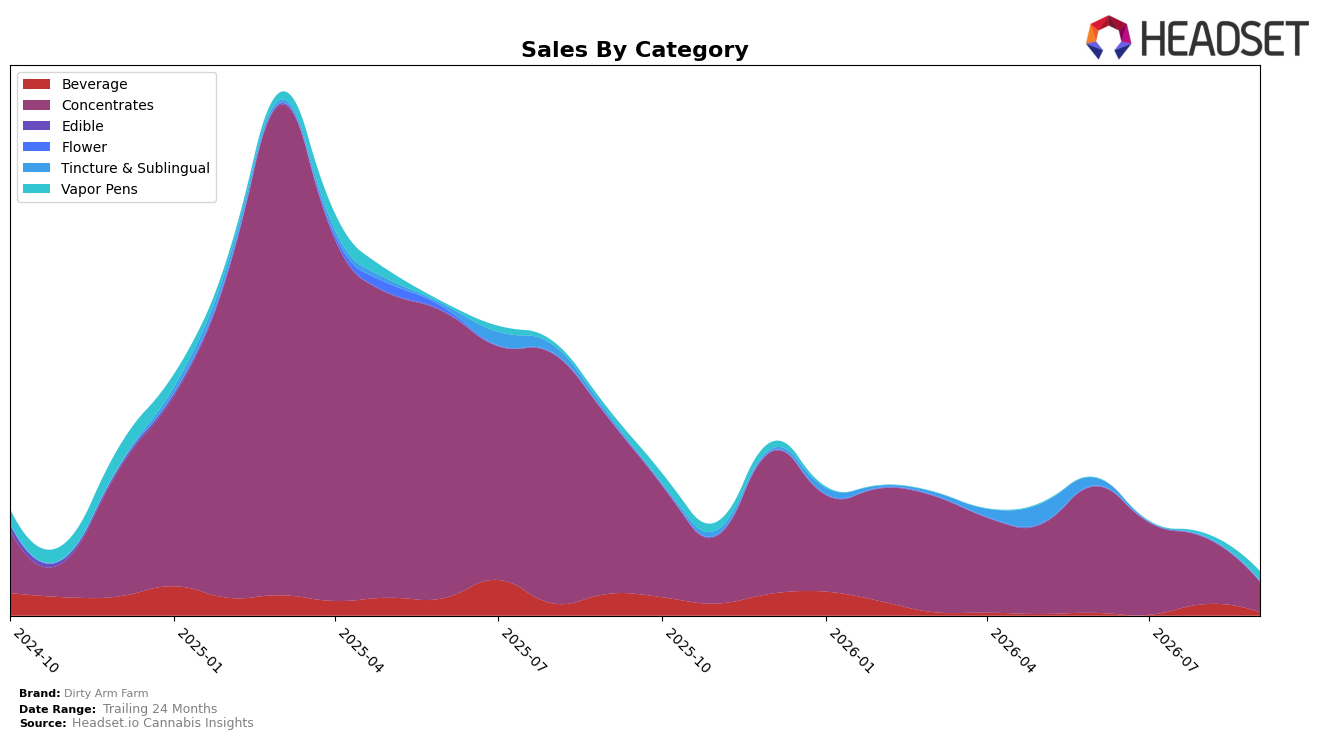
In September 2026, Dirty Arm Farm derived 71.65% of sales from Concentrates with a year-over-year decline of 82.92% and a month-over-month drop of 54.64%, while Vapor Pens expanded to a 21.39% share on 107.07% year-over-year growth and 236.41% month-over-month growth; Beverage contracted to 6.95% share with year-over-year down 86.39% and month-over-month down 73.72%. Average price fell 19.54% year over year to $26.09, with category pricing divergence (Concentrates at $23.52 versus Vapor Pens at $35.01) signaling a mix shift toward higher-price-per-unit formats that partially offsets volume pressure; the thesis is that the brand is rapidly transitioning away from legacy Concentrates into Vapor Pens, using price-tier variation to cushion steep declines in its core.
Positioning-wise, a 71.65% mix in Concentrates paired with a rank of 56 in Concentrates in Oregon indicates overexposure to a weakening anchor while the 236.41% month-over-month surge in Vapor Pens and 107.07% year-over-year growth give the brand a scalable on-ramp in a higher-ticket segment. With Beverage shrinking 73.72% month over month and 86.39% year over year, the portfolio is effectively concentrating into two poles—value-leaning Concentrates and premium-leaning Vapor Pens—implying a barbell strategy where near-term share defense depends on stabilizing Concentrates sell-through while channeling incremental assortment and marketing into Vapor Pens to rebuild rank velocity.
Competitive Landscape
Dirty Arm Farm sits at rank 56 in OR Concentrates in September 2026, down 34 positions year over year from rank 22, and 26 positions below its June 2026 level at rank 30; this contrasts with a historical peak at rank 7 in March 2025 and a current top-tier led by Altered Alchemy at rank 1 and Oregrown climbing from rank 3 to rank 2 alongside a 38.38% sales YoY change, while Red Eye Extracts (OR) slipped from rank 2 to rank 3 with an 11.00% YoY sales decline; the widening gap between Dirty Arm Farm’s 34-rank YoY drop and competitors’ upward or stable positions implies the brand’s shelf presence has migrated from mid-tier to fringe, signaling a need to arrest share erosion before further displacement cements in the category.

Notable Products
Pink Panties Live Rosin (1g) posted the steepest decline at -69.7% MoM while dropping to rank 4, and Mango Rosin Adabinol Syrup (1000mg THC, 4oz) fell -73.7% MoM at rank 7, together signaling demand compression outside the few surging SKUs. In contrast, Tropicanna Hash Rosin Disposable (1g) jumped +236.4% MoM to rank 1 and GMO x Chem D Live Rosin (1g) rose +77.2% MoM to rank 2, and with four of the top ten in Concentrates despite GMO x Chem D Cold Cure Rosin (1g) sliding -12.9% MoM at rank 3, the portfolio is concentrating around solventless and vapor formats. Tear Gas Rosin (1g) advanced +92.8% MoM while tied at rank 4, and Frozen Banana Cold Cure Solventless Live Rosin (2g) declined -22.4% MoM at rank 8, indicating a tilt toward single-gram, fast-turn SKUs over larger formats. The pattern implies Dirty Arm Farm is pivoting share toward high-velocity inhalable units, with beverages and select legacy rosin variants ceding space to a growing anchor in vapor and a narrower set of solventless hits.
Top Selling Cannabis Brands






Data for this report comes from real-time sales reporting by participating cannabis retailers via their point-of-sale systems, which are linked up with Headset’s business intelligence software. Headset’s data is very reliable, as it comes digitally direct from our partner retailers. However, the potential does exist for misreporting in the instance of duplicates, incorrectly classified products, inaccurate entry of products into point-of-sale systems, or even simple human error at the point of purchase. Thus, there is a slight margin of error to consider. Brands listed on this page are ranked in the top twenty within the market and product category by total retail sales volume.

