Jun-2026
Sales
Trend
6-Month
Product Count
SKUs
Avg Price
YoY Sales Change
YoY Price Change
Market Insights Snapshot
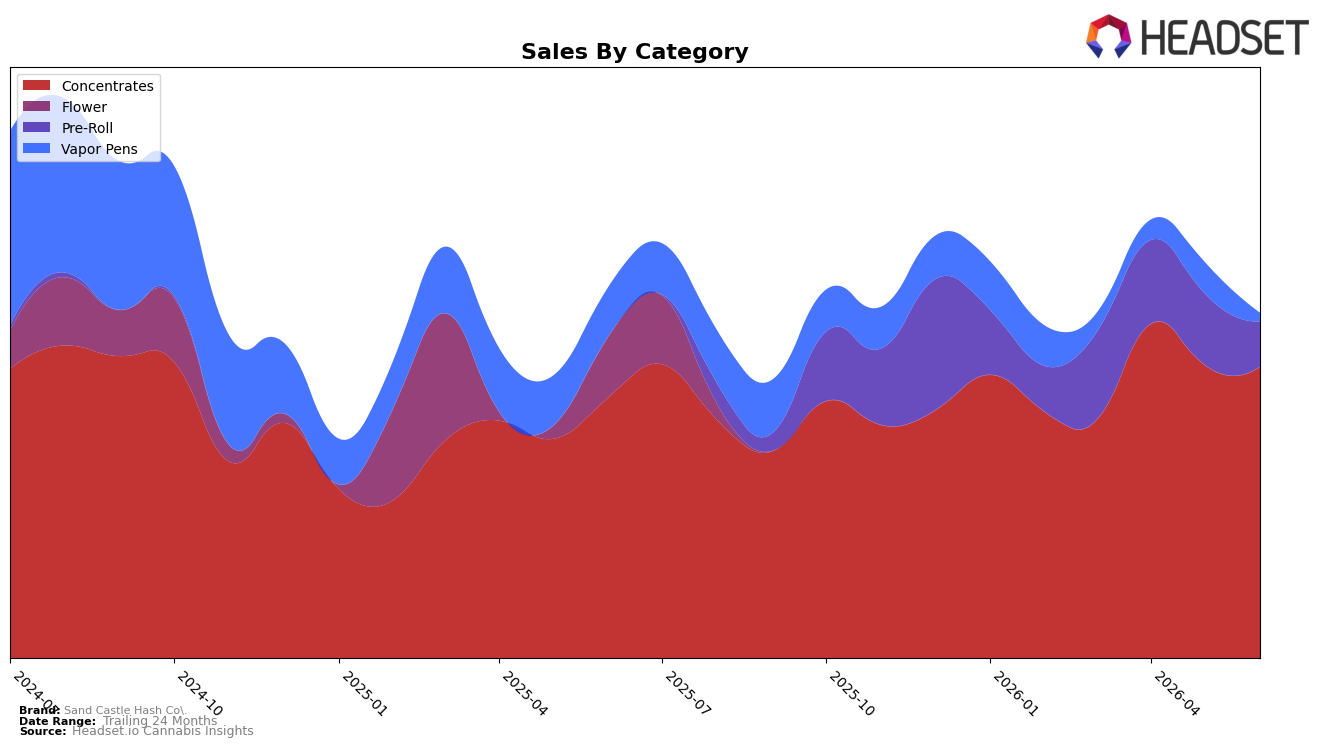
In June 2026, Sand Castle Hash Co. concentrated 84.53% of sales in Concentrates while Pre-Roll accounted for 13.05% and Vapor Pens 2.42%, indicating a tighter mix toward Concentrates versus May’s distribution as Pre-Roll fell 36.92% month over month and Vapor Pens dropped 73.30% month over month. Within Concentrates, sales grew 11.77% year over year despite a 0.62% month-over-month dip, while Vapor Pens contracted 83.07% year over year, and brandwide sales declined 6.95% year over year alongside a 20.53% year-over-year average price decline; the pattern implies deliberate prioritization of Concentrates at lower price points while exiting or de-emphasizing Vapor Pens.
Positioning in Oregon Concentrates at rank 25, combined with an 11.77% year-over-year category lift but a 0.62% month-over-month dip, signals a focus on defending mid-pack share while trading price for volume, as suggested by a 20.53% brandwide price decline versus an 84.53% category share concentration. The simultaneous 36.92% month-over-month contraction in Pre-Roll and 73.30% month-over-month decline in Vapor Pens, paired with a 36.31% 24-month sales contraction overall, implies a pruning strategy that centers resources on Concentrates to stabilize rank and reduce exposure to underperforming formats.
Competitive Landscape
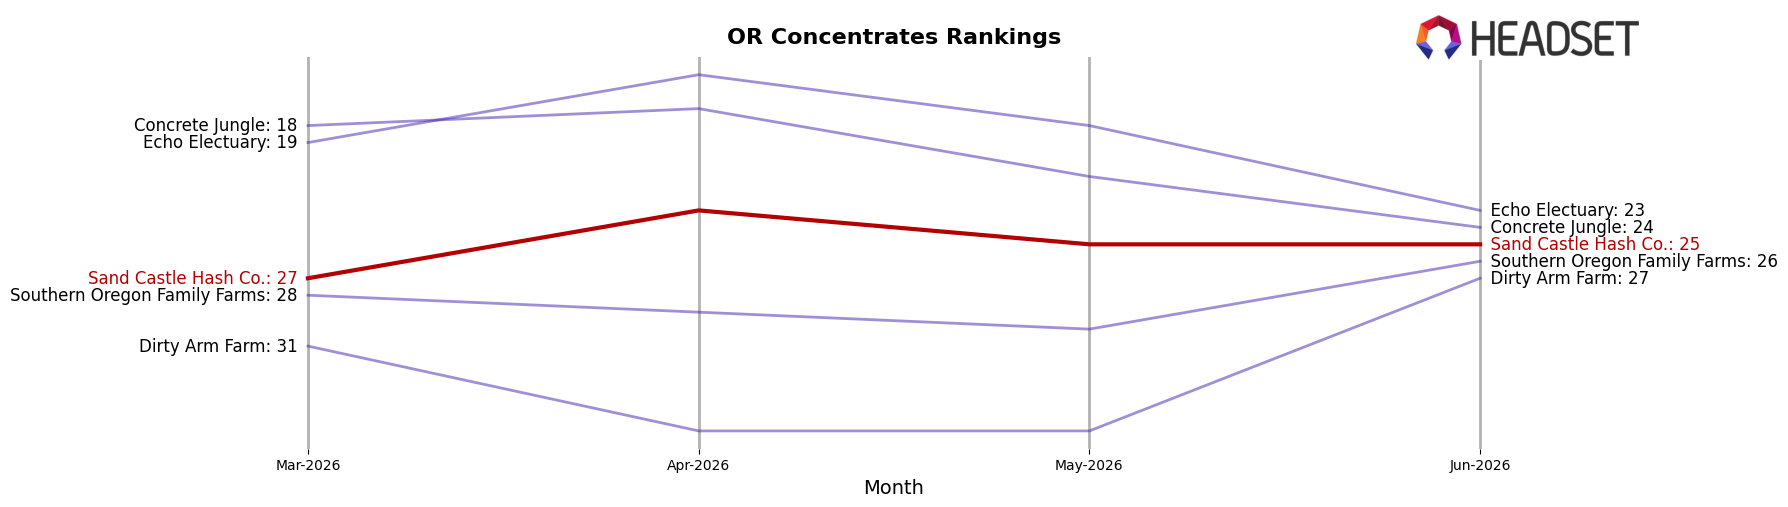
Sand Castle Hash Co. sits at rank #25 in OR Concentrates for June 2026, improving 4 positions from #29 year over year and slipping 2 spots from #27 over the past three months; the brand’s peak at #21 in October 2024 marks a 4-rank gap from today. Competitive movement is sharper at the top: Oregrown climbed from #3 to #2 with a 153.4% year-over-year sales change while Altered Alchemy held #1 despite a -9.7% shift, and Buddies advanced from #8 to #4 alongside a 77.1% increase; by contrast, Sand Castle Hash Co.’s 4-rank YoY gain paired with a 2-rank three-month dip indicates incremental traction that is being outpaced by faster risers, implying the current trajectory supports mid-pack stability rather than a near-term return to its #21 peak.
Notable Products
Cosmic Crisp Temple Ball Hash (1g) posted the standout move, up 182.7% month over month to claim rank 1, while Superboof x Sour Apple Infused Pre-Roll (1g) fell 33.7% to rank 8. Power Plant Bubble Hash (1g) added breadth with a 94.6% MoM gain at rank 2, and Portofino Temple Ball Hash (1g) slipped 10.1% at rank 4. With eight of the top ten in Concentrates and Temple Ball Hash variants occupying ranks 1, 3, 4, 5, 7, and 9, the mix points to a pivot toward solventless hash leadership even as Pre-Rolls de-emphasize volume and visibility.
Top Selling Cannabis Brands
Data for this report comes from real-time sales reporting by participating cannabis retailers via their point-of-sale systems, which are linked up with Headset’s business intelligence software. Headset’s data is very reliable, as it comes digitally direct from our partner retailers. However, the potential does exist for misreporting in the instance of duplicates, incorrectly classified products, inaccurate entry of products into point-of-sale systems, or even simple human error at the point of purchase. Thus, there is a slight margin of error to consider. Brands listed on this page are ranked in the top twenty within the market and product category by total retail sales volume.

