.svg)

Aug-2026
Sales
Trend
6-Month
Product Count
SKUs
Avg Price
YoY Sales Change
YoY Price Change


Where to Buy
Do Drops is stocked at 74 licensed dispensaries across Maryland and Oregon, 73 of them in Maryland, with the deepest coverage in Baltimore, Hagerstown, Laurel, Rockville, and Silver Spring. Search by ZIP code or city below to find the closest one.
Market Insights Snapshot
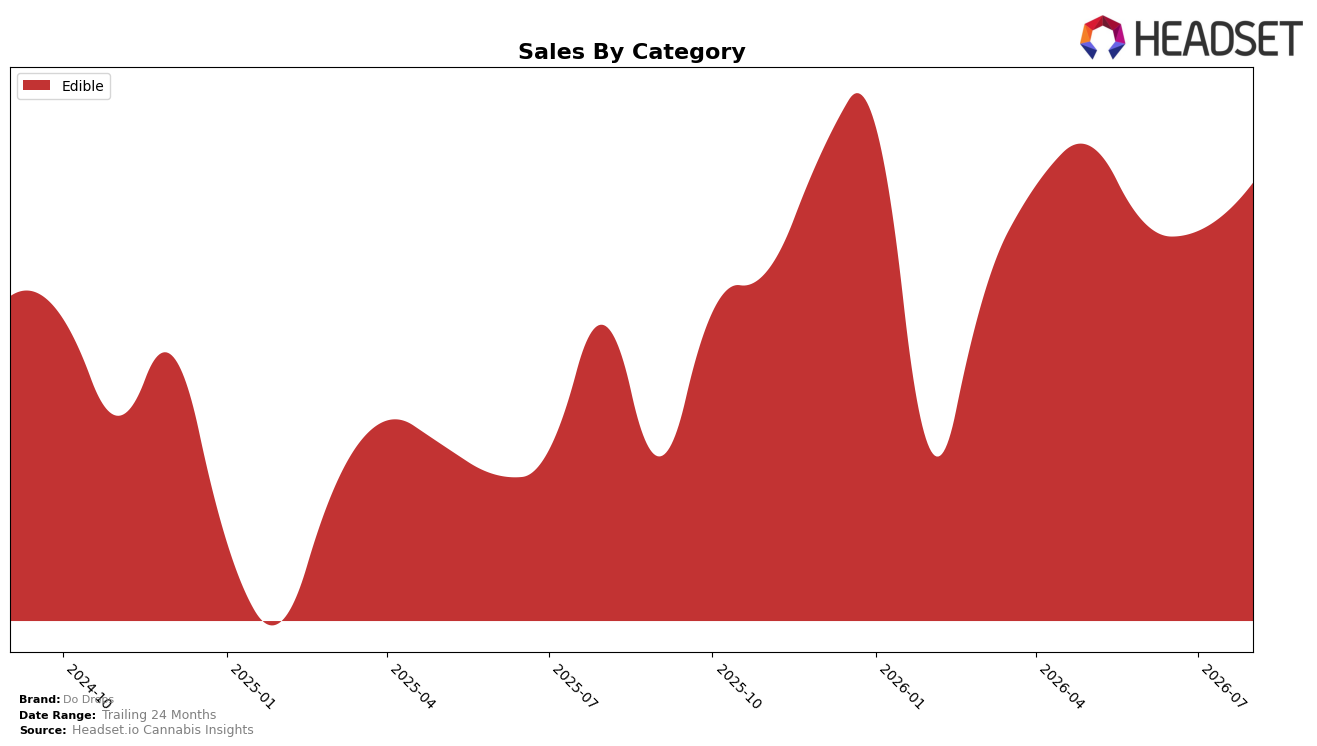
In August 2026, Do Drops operated as a single-category brand, with Edible accounting for 100.0% of sales and a month-over-month change of 4.98% alongside a year-over-year rise of 16.25%. The brand’s average price fell 8.08% YoY while unit velocity implied by a 4.98% MoM sales lift signals volume-led gains at a 100.0% category concentration. With a rank of 10 in Edible in Maryland and a 16.25% YoY growth rate, the pattern implies that August 2026 results were driven by a deliberate price/mix shift within a fully concentrated Edible portfolio rather than by diversification across categories.
The combination of an 8.08% YoY price decline and 16.25% YoY sales growth suggests Do Drops is leaning into value-driven volume expansion, while the 4.98% MoM lift points to short-term momentum within Edibles rather than multi-category reach. Holding the 10th rank in Edible in Maryland during August 2026, coupled with a 100.0% category share, implies positioning as a focused Edible player prioritizing price elasticity and repeat purchase over portfolio breadth.
Competitive Landscape
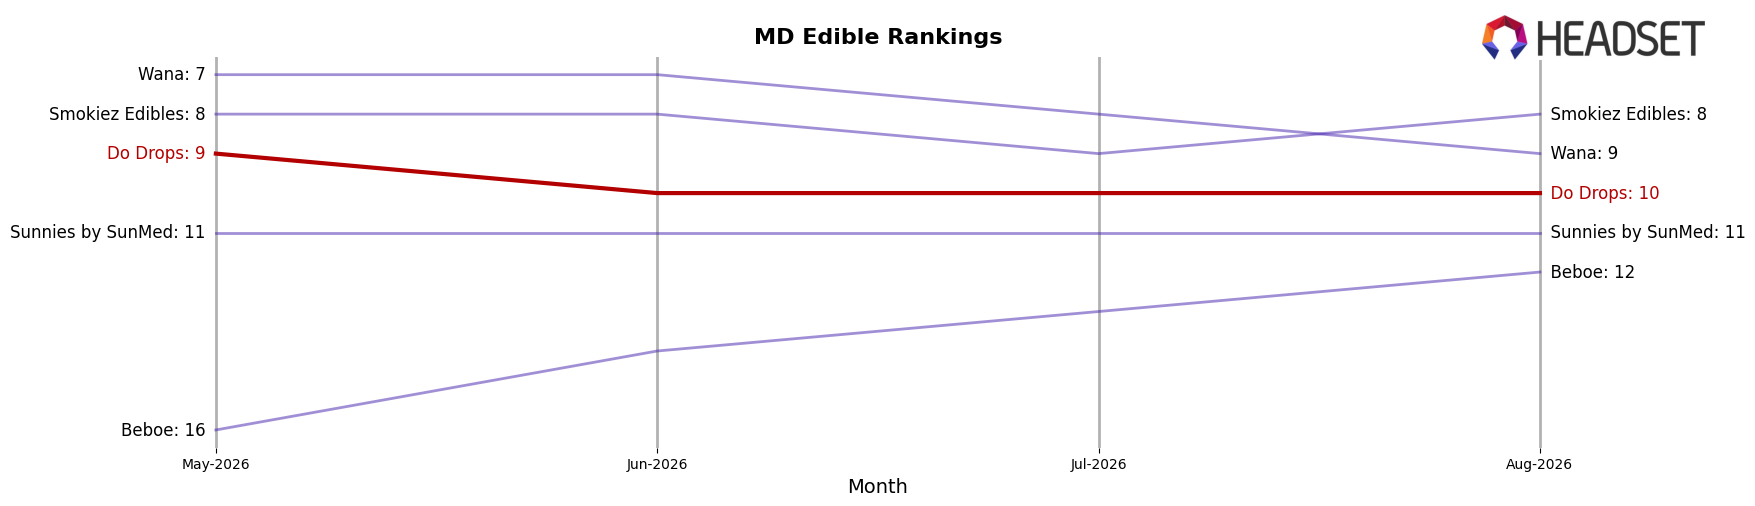
Do Drops sits at rank #10 in MD Edible in August 2026, a 1-place improvement from #11 year over year, but down 1 spot from #9 in May 2026, signaling a narrow band of movement. While Do Drops slipped 1 rank since May 2026, Incredibles climbed from #3 to #1 with a 46.3% YoY sales increase, and In House advanced from #6 to #3 on 44.9% YoY growth, whereas Wyld fell from #1 to #4 alongside a 28.7% YoY sales decline; against this mix, Do Drops’ YoY rank gain of 1 and 3-month slide of 1 imply a middle-tier position that benefits when top brands rotate but hasn’t yet converted volatility into sustained upward momentum.
Notable Products
With no SKU posting a month-over-month surge above +50% or a decline below -10% in August 2026, the most material movement is the -8.7% drop for Mild - CBD/THC 2:1 Melon Gummies 10-Pack (100mg CBD, 50mg THC), which slid while holding rank 7, implying softness in lighter-dose formats relative to higher-potency or function-led offerings. Sleep - CBN/THC 1:1 Slumberberry Gummies 10-Pack (100mg CBN, 100mg THC) rose +15.6% to remain rank 1, while Energy - CBD/CBG/THC 2:2:1 Lemon Citrus Gummies 10-Pack (200mg CBD, 200mg CBG, 100mg THC) edged up +2.7% at rank 2, indicating consumers are concentrating spend at the top of the functional ladder rather than broadening basket mix. Nine of the top ten are Edible SKUs with functional positioning and three distinct 10-Pack leaders occupy ranks 1, 2, and 3 with gains of +15.6%, +2.7%, and +6.4%, respectively, which suggests Do Drops is consolidating share around multi-cannabinoid, purpose-driven gummies rather than variety-driven extensions.
Top Selling Cannabis Brands






Data for this report comes from real-time sales reporting by participating cannabis retailers via their point-of-sale systems, which are linked up with Headset’s business intelligence software. Headset’s data is very reliable, as it comes digitally direct from our partner retailers. However, the potential does exist for misreporting in the instance of duplicates, incorrectly classified products, inaccurate entry of products into point-of-sale systems, or even simple human error at the point of purchase. Thus, there is a slight margin of error to consider. Brands listed on this page are ranked in the top twenty within the market and product category by total retail sales volume.

