.svg)
Sep-2026
Sales
Trend
6-Month
Product Count
SKUs
Avg Price
YoY Sales Change
YoY Price Change


Where to Buy
Beboe is stocked at 311 licensed dispensaries across Illinois, Maryland, and 9 other states, 67 of them in Illinois, with the deepest coverage in Chicago, Quincy, Joliet, Normal, and Anna. Search by ZIP code or city below to find the closest one, or filter by product type if you are after a specific format.
Market Insights Snapshot
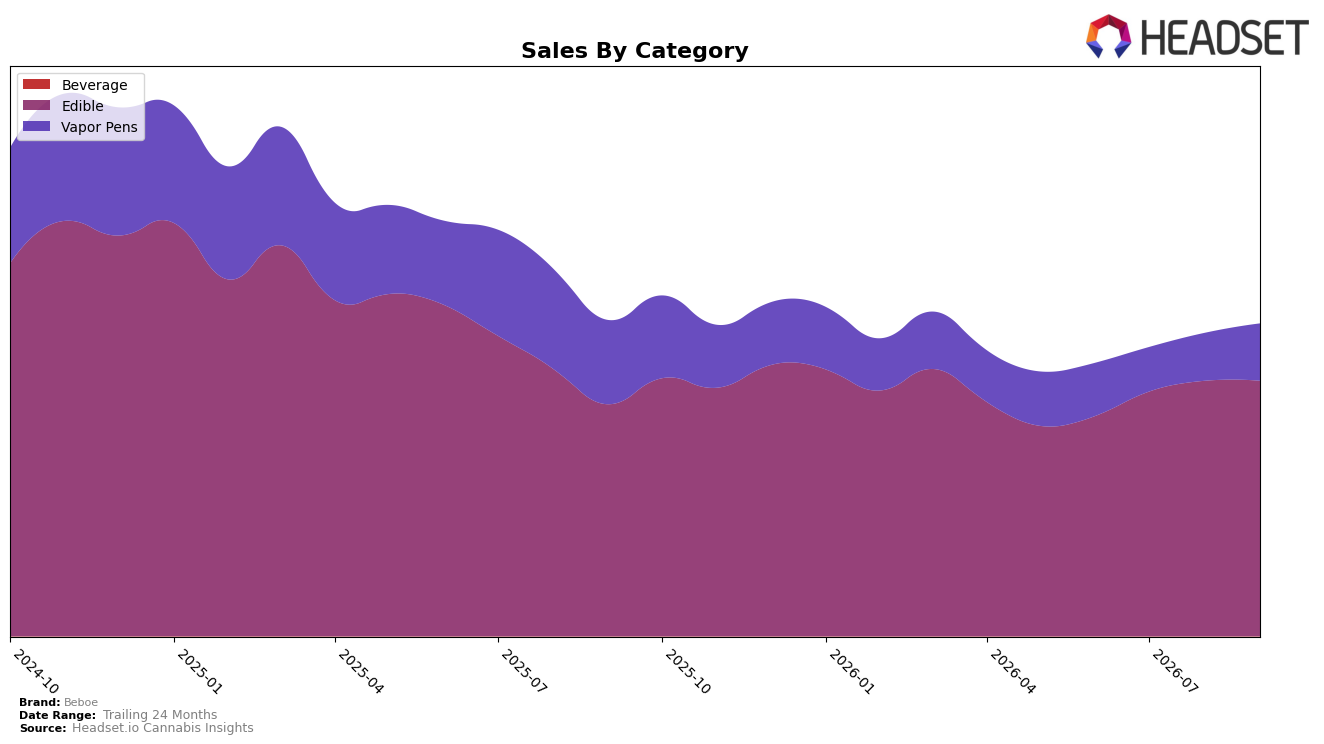
In September 2026, Beboe concentrated 81.74% of sales in Edible, up 10.14% year over year but nearly flat month over month at 0.95%, while Vapor Pens held 18.26% share with a 32.05% YoY decline yet a 19.85% MoM rebound; average price fell 11.01% YoY to $17.29, suggesting volume gains were needed to offset pricing pressure. Within Edible, the category’s steadier MoM at 0.95% versus Vapor Pens’ 19.85% MoM lift indicates mix stability anchored by Edible even as Beboe’s overall sales declined 1.07% YoY and 40.33% over 24 months, implying the brand is leaning on Edible consistency to cushion volatility in Vapor Pens.
Beboe’s rank at 12 in Edible in Maryland alongside an 81.74% mix concentration signals a defensible core where incremental share moves are more likely to change rank than chasing recovery in Vapor Pens’ 32.05% YoY drop; the modest 0.95% MoM in Edible relative to the 19.85% MoM in Vapor Pens implies that tactical wins exist in Vapor Pens without overcommitting mix. The combination of lower prices (down 11.01% YoY) and a stable Edible base suggests positioning as an accessible Edible specialist, with selective Vapor Pen promotions to capture MoM pockets, implying Beboe can protect rank with Edible while using episodic Vapor Pen lifts to test price-elastic volume without diluting the core.
Competitive Landscape
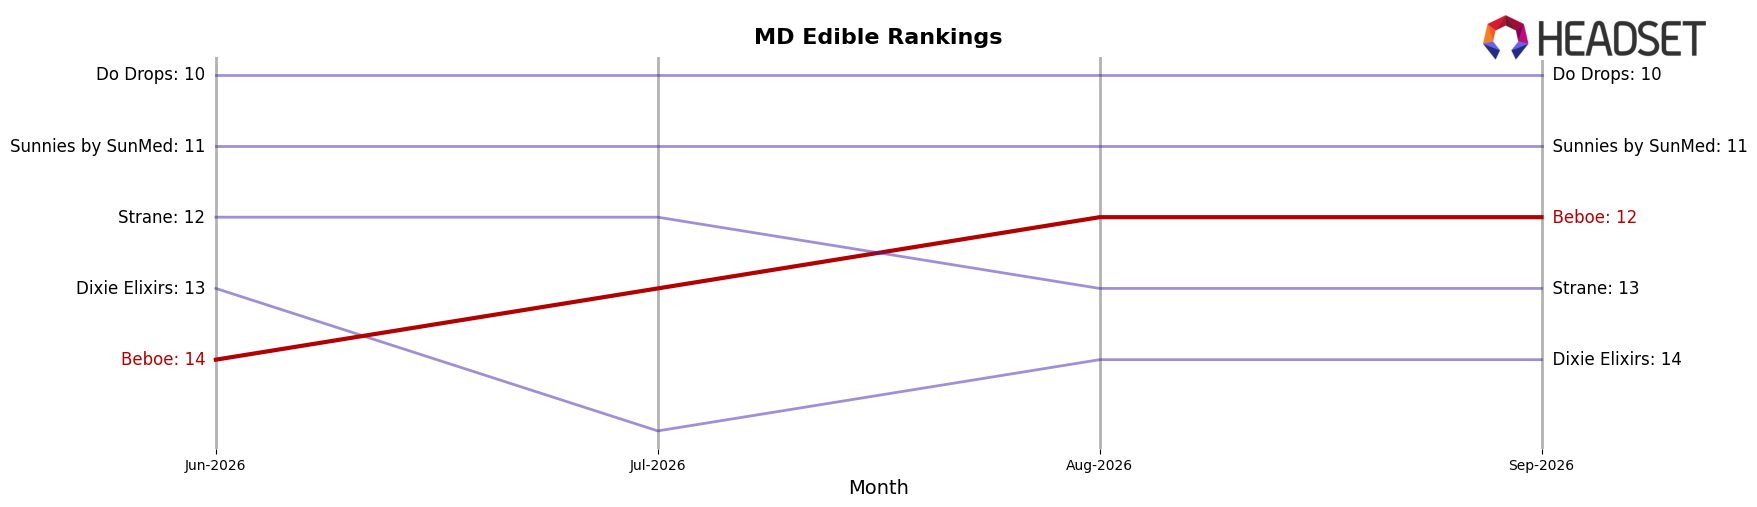
Beboe is ranked #12 in MD Edible for September 2026, improving 8 positions from #20 year over year and 2 positions from #14 in June 2026, while still trailing its peak at #10 in March 2025; by contrast, Incredibles climbed from #5 to #1 with 58.1% year-over-year sales growth and Betty's Eddies held at #2 year over year despite a 7.3% sales decline, indicating that Beboe’s upward rank drift is occurring amid both aggressive ascenders and vulnerable incumbents, and the trajectory implies room to convert recent incremental gains into a return to the top 10 if momentum is sustained.
Notable Products
Inspired Blood Orange Gummies 20-Pack (100mg) posted the steepest decline in September 2026 at -27.1% and slid to rank 6, while Anytime Huckleberry Gummies 20-Pack (100mg) fell -13.0% to rank 3, signaling demand rotation away from legacy fruit SKUs toward functional formulations. THC/CBN 5:1 Sweet Dreams Raspberry Plum Berry Gummies 20-Pack (100mg THC, 20mg CBN) rose 7.8% and held rank 2, and CBD/THC 2:1 Sour Golden Peach Remedy Gummies 20-Pack (200mg CBD, 100mg THC) climbed 21.6% to rank 4, indicating momentum in minor-cannabinoid blends even as THC/CBG 1:1 Sparkling Pear Cloud 9 Gummies 20-Pack (100mg THC, 100mg CBG) in rank 1 grew 3.3% with approximately $102,731 in sales. Eight of the top ten products are Edibles, concentrating the lineup in a single category despite Vapor Pens appearing at ranks 9 and 10 with no month-over-month reads, which implies Beboe’s near-term revenue is anchored in gummies while disposables remain ancillary and data-light.
Top Selling Cannabis Brands






Data for this report comes from real-time sales reporting by participating cannabis retailers via their point-of-sale systems, which are linked up with Headset’s business intelligence software. Headset’s data is very reliable, as it comes digitally direct from our partner retailers. However, the potential does exist for misreporting in the instance of duplicates, incorrectly classified products, inaccurate entry of products into point-of-sale systems, or even simple human error at the point of purchase. Thus, there is a slight margin of error to consider. Brands listed on this page are ranked in the top twenty within the market and product category by total retail sales volume.

