Jun-2026
Sales
Trend
6-Month
Product Count
SKUs
Avg Price
YoY Sales Change
YoY Price Change
Market Insights Snapshot
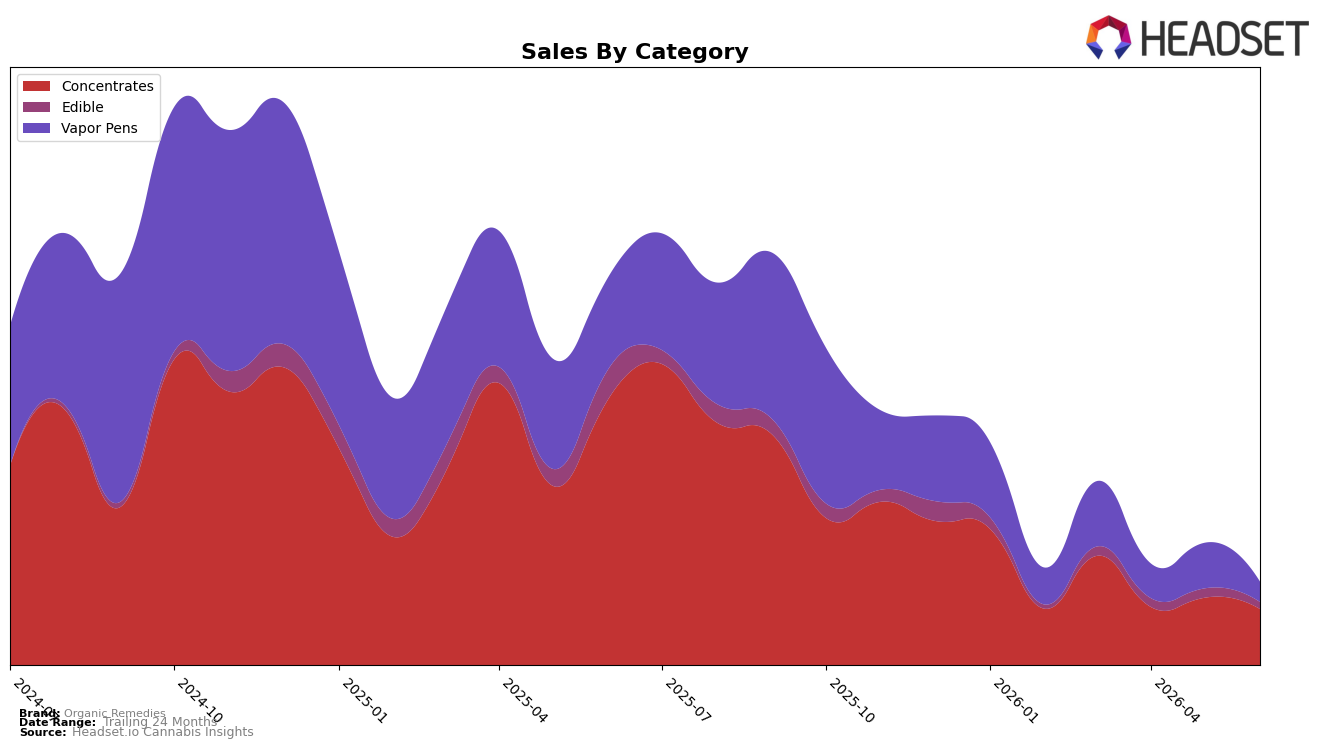
Organic Remedies’ mix in June 2026 is concentrated in Concentrates at 66.79% share with year-over-year decline of 78.67% and month-over-month decline of 16.55%, while Vapor Pens hold 24.46% share with year-over-year decline of 77.50% and month-over-month decline of 54.75%. Edible contributes 8.74% share, down 75.51% year-over-year and 23.91% month-over-month, and average price across the brand fell 15.33% year-over-year to $29.64. With rank 20 in Concentrates in Maryland, the steep month-over-month drop in Vapor Pens relative to the smaller month-over-month drop in Concentrates implies the portfolio is tilting further toward Concentrates despite broad year-over-year contraction, signaling reliance on a single lead category as category breadth narrows.
The pattern implies a defensive positioning around Concentrates where a 16.55% month-over-month decline contrasts with the 54.75% month-over-month drop in Vapor Pens and the 23.91% month-over-month drop in Edible, concentrating demand share even as total brand sales are down 78.15% year-over-year. The 20th rank in Concentrates in Maryland combined with a 15.33% year-over-year price reduction suggests that price moves are not offsetting volume erosion, so near-term positioning hinges on protecting Concentrates velocity while rebaselining Vapor Pens and Edible to prevent further share loss from the current 24.46% and 8.74% levels.
Competitive Landscape
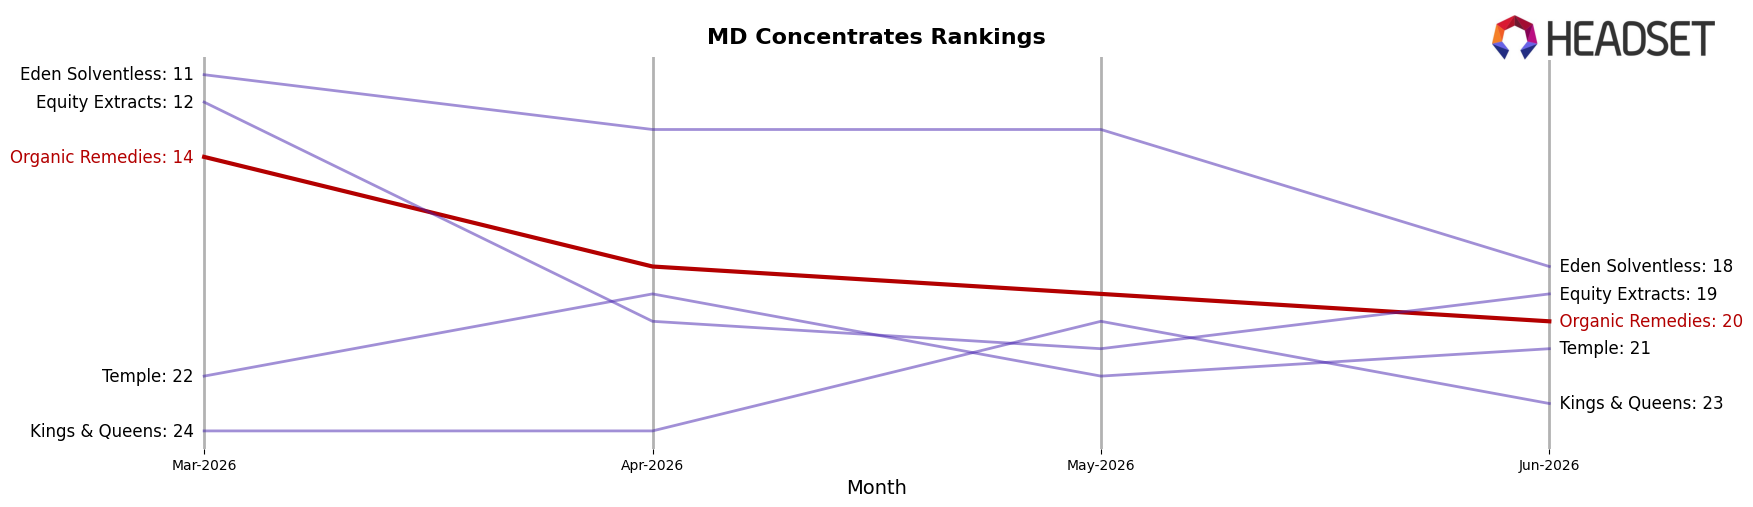
Organic Remedies sits at rank #20 in MD Concentrates in June 2026, falling 13 positions year over year from #7, and sliding 6 spots from March 2026 when it was #14; by contrast, District Cannabis rose to #1 with a 35.7% YoY sales increase while Evermore Cannabis Company improved its position to #3 from #4 as sales grew 23.2%. The brand’s current rank is also 14 places below its August 2025 peak of #6, while Nature's Heritage moved down to #5 from #3 despite 17.2% YoY growth, indicating that Organic Remedies’ decline is steeper than peers gaining or holding top-5 ranks. The pattern implies a loss of competitive momentum: dropping from #14 to #20 in three months and from #7 to #20 in a year suggests share is consolidating among top brands, and without reversing this rank trajectory Organic Remedies risks further displacement in the next two quarters.
Notable Products
Neapolitan Cured Sugar (3g) posted the steepest move in June 2026 at -39.6% MoM and held rank 6, while the Midnight Circus x Durban Poison Blended Full Spectrum Cartridge (0.5g) fell -38.4% to rank 4. In contrast, Blue Beach Haze Cured Badder (1g) rose 29.8% MoM to rank 1 with approximately $10.5k in sales, creating a split picture where Concentrates both led and contracted. With six of the top ten coming from Concentrates, the category concentration is high even as one key Vapor Pens SKU slipped sharply, implying Organic Remedies is leaning into extract-led leadership while pruning underperforming vape formats.
Top Selling Cannabis Brands
Data for this report comes from real-time sales reporting by participating cannabis retailers via their point-of-sale systems, which are linked up with Headset’s business intelligence software. Headset’s data is very reliable, as it comes digitally direct from our partner retailers. However, the potential does exist for misreporting in the instance of duplicates, incorrectly classified products, inaccurate entry of products into point-of-sale systems, or even simple human error at the point of purchase. Thus, there is a slight margin of error to consider. Brands listed on this page are ranked in the top twenty within the market and product category by total retail sales volume.

