Jun-2026
Sales
Trend
6-Month
Product Count
SKUs
Avg Price
YoY Sales Change
YoY Price Change
Market Insights Snapshot
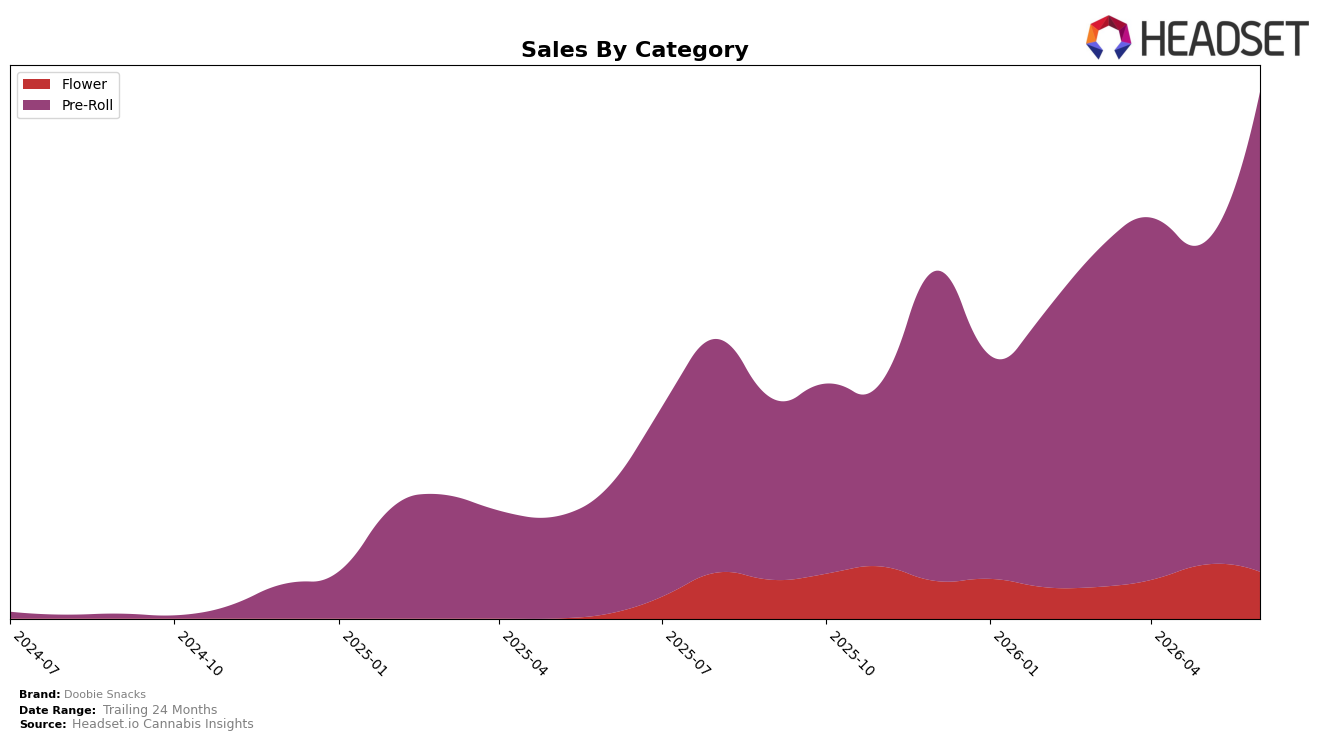
In June 2026, Doobie Snacks concentrated 91.11% of sales in Pre-Roll, up 48.84% month over month and 279.63% year over year, while Flower held 8.89% share with a -13.17% MoM decline but an 870.35% YoY surge; average price across the brand fell 7.54% YoY to $17.33, with Pre-Roll averaging $17.04 versus Flower at $21.05. Within the Pre-Roll category in Saskatchewan, the brand sat at rank 3, and the combination of a MoM expansion in the dominant category alongside a MoM pullback in the smaller category implies the mix is tilting further toward high-velocity Pre-Rolls at lower price points.
The mix shifts suggest a price-led penetration play in Pre-Rolls, where a 48.84% MoM volume expansion paired with a 7.54% YoY brand-wide price decrease supports scale, while Flower’s -13.17% MoM coupled with an 870.35% YoY rebound indicates episodic gains rather than sustained share capture. Holding rank 3 in Pre-Roll in Saskatchewan alongside a 91.11% category reliance implies positioning as a Pre-Roll specialist, and the widening gap between Pre-Roll momentum and Flower retrenchment points to a strategy that prioritizes defending and trading up within Pre-Roll over diversifying mix in the near term.
Competitive Landscape
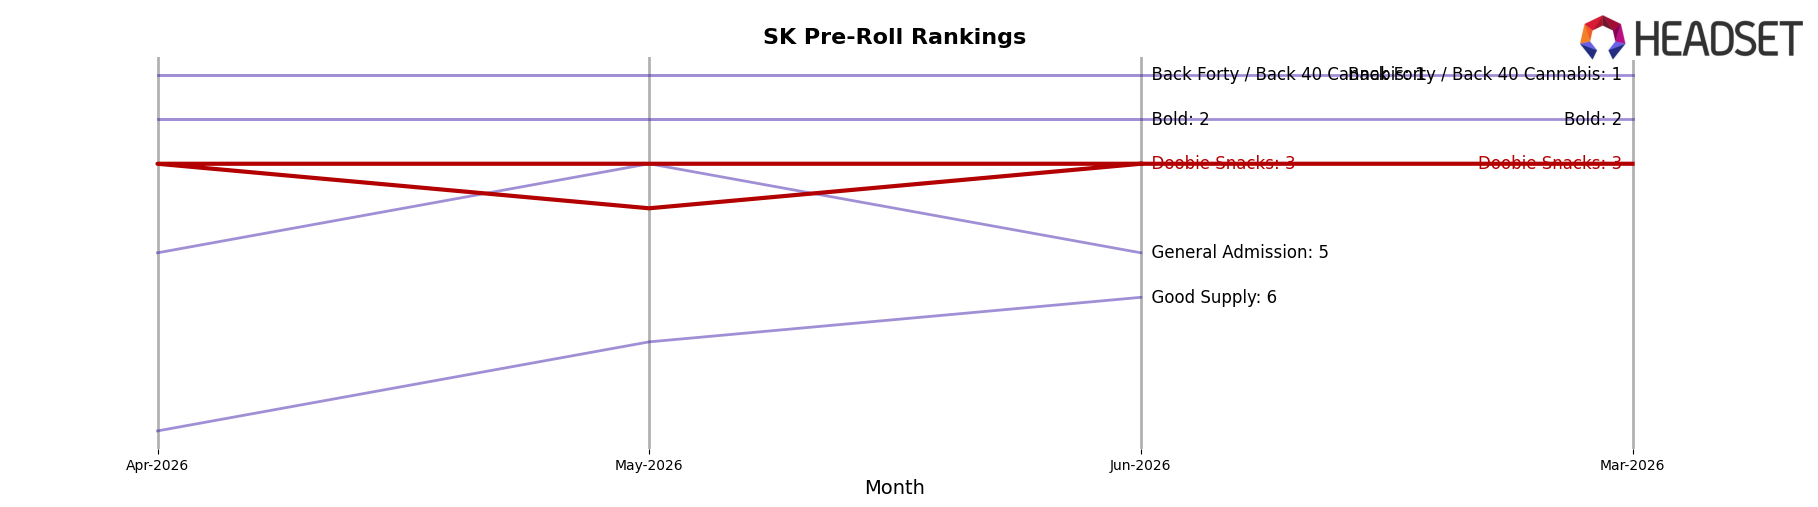
Doobie Snacks is ranked #3 in SK Pre-Roll in June 2026, up 6 positions year over year from #9, and matching its 3-month rank at #3 while hitting a peak rank of #3 in June 2026; by comparison, Back Forty / Back 40 Cannabis held #1 with 134.2% YoY sales growth and Bold stayed at #2 with 117.1% YoY growth, whereas Spinach slipped from #3 YoY to #4 current and General Admission moved from #4 YoY to #5 current; the combination of a 6-rank YoY climb and stabilization at #3 implies Doobie Snacks has transitioned from chasing the leaders to defending a podium position against mid-pack risers.
Notable Products
Peach Please! Pre-Roll 4-Pack (2g) posted the largest move in June 2026 with an 82.7% month-over-month gain, climbing into rank 3 as Blue Slushee Pre-Roll 4-Pack (2g) led at rank 1 with +59.8% and Grape Jelly Pre-Roll 4-Pack (2g) held rank 2 at +58.8%. Nine of the top ten SKUs are Pre-Roll 4-Packs, indicating a pack-size concentration that coincides with multiple 50%+ surges, while Moonberry Pre-Roll 4-Pack (2g) advanced to rank 4 at +44.8% and Pink Dragon Pre-Roll 4-Pack (2g) reached rank 5 at +48.2%.
Atomic Pop Pre-Roll 4-Pack (2g) and White Gummy Pre-Roll 4-Pack (2g) each exceeded +56%, slotting into ranks 8 and 9, while Cherry Sakura Pre-Roll 4-Pack (2g) and Unicorn Piss Pre-Roll 4-Pack (2g) grew +23.3% and +34.3% at ranks 6 and 7. Animal Kush Nudes Pre-Roll 5-Pack (2.5g) entered the top ten at rank 10 with no reported month-over-month rate and $30,465 in sales, implying a secondary role for 5-packs compared with the faster-scaling 4-packs.
The pattern of three SKUs above +57% in the top three ranks and two more above +56% in the lower top ten points to a demand bulge centered on flavored Pre-Roll 4-Packs, implying Doobie Snacks is consolidating share by doubling down on variety-led multipacks rather than format expansion.
Top Selling Cannabis Brands
Data for this report comes from real-time sales reporting by participating cannabis retailers via their point-of-sale systems, which are linked up with Headset’s business intelligence software. Headset’s data is very reliable, as it comes digitally direct from our partner retailers. However, the potential does exist for misreporting in the instance of duplicates, incorrectly classified products, inaccurate entry of products into point-of-sale systems, or even simple human error at the point of purchase. Thus, there is a slight margin of error to consider. Brands listed on this page are ranked in the top twenty within the market and product category by total retail sales volume.

