Jan-2026
Sales
Trend
6-Month
Product Count
SKUs
Avg Price
YoY Sales Change
YoY Price Change
Market Insights Snapshot
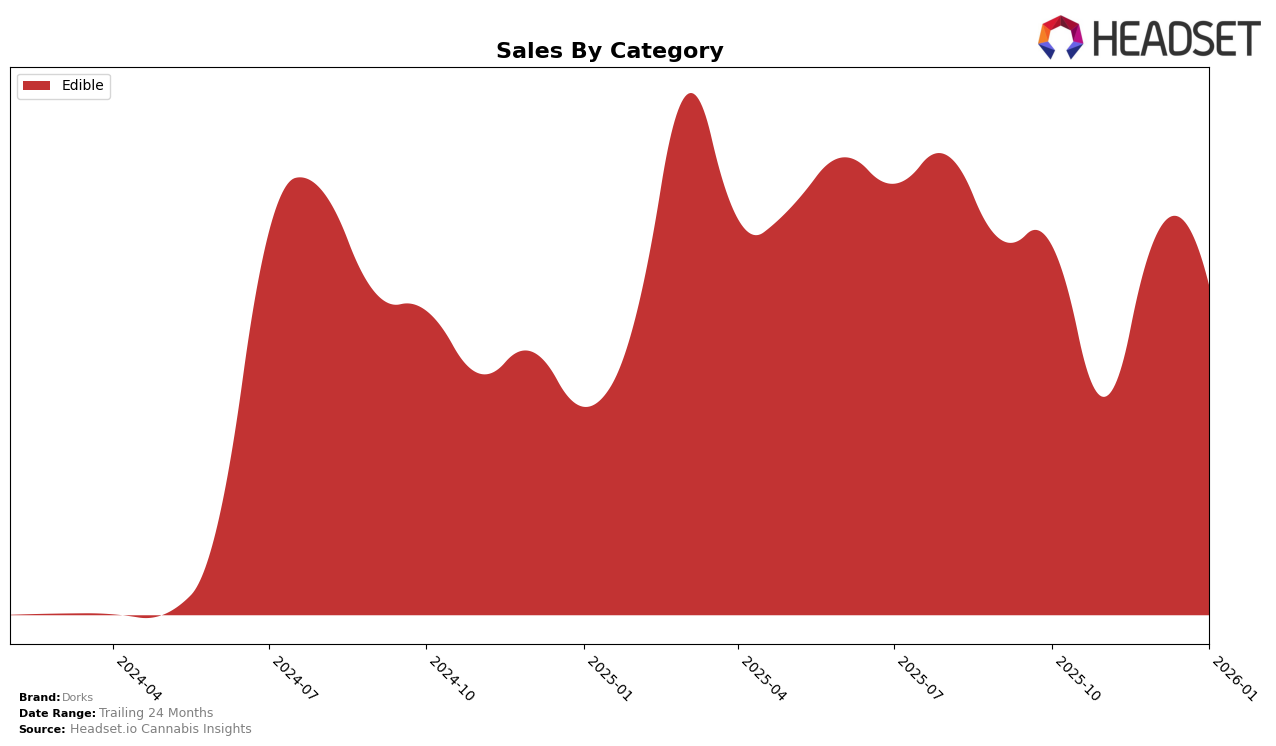
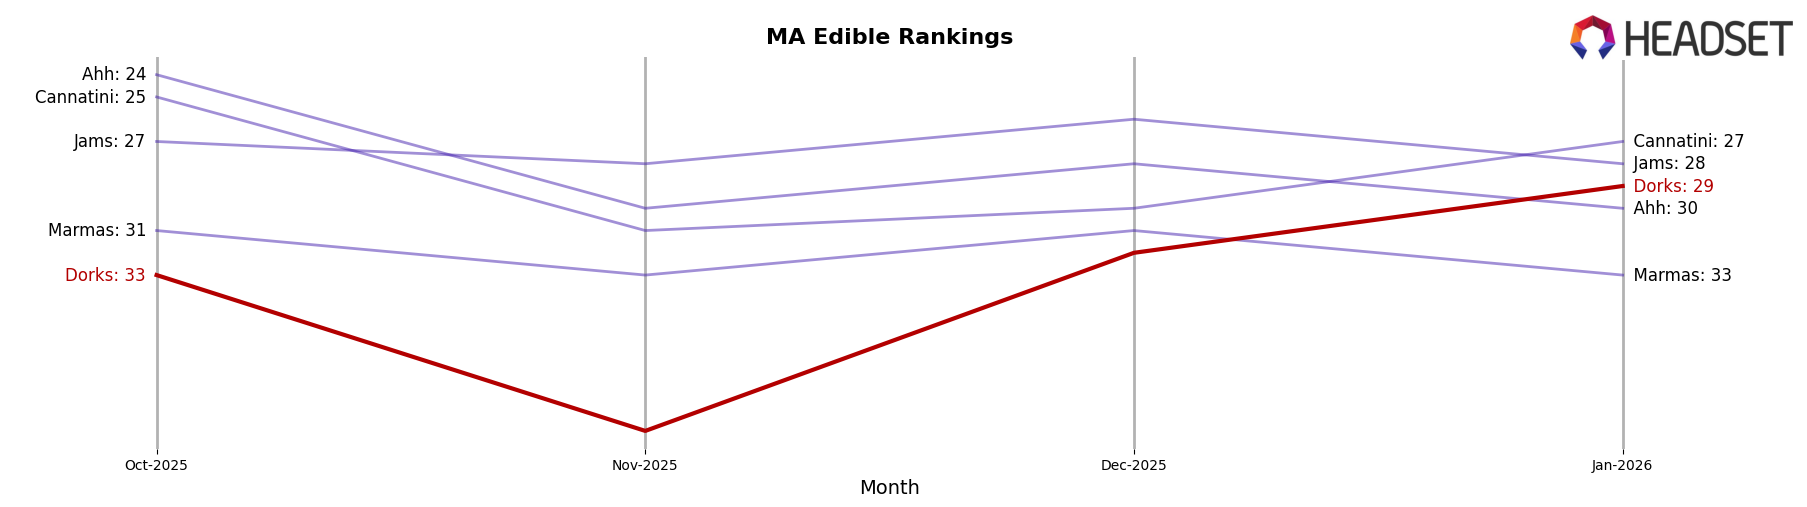
In the state of Massachusetts, Dorks has shown a commendable upward trajectory in the Edible category. Starting from a rank of 33 in October 2025, they climbed to 29 by January 2026, indicating a positive trend in consumer preference and market penetration. This improvement is supported by their sales figures, which saw a substantial increase from $37,670 in November to $76,768 in January. Such a movement suggests that Dorks is successfully capturing a larger share of the Edible market in Massachusetts, although there is still room for further growth and consolidation to break into the top 20 brands.
Conversely, in Michigan, Dorks has struggled to make a significant impact in the same category. The brand's ranking has not breached the top 30, with positions fluctuating between 84 and 91 from October to December 2025. Notably, by January 2026, Dorks did not rank within the top 30, indicating challenges in maintaining a competitive edge or consumer interest in this market. Despite a slight increase in sales from November to December, Dorks's absence from January's rankings suggests that they may need to reconsider their strategy in Michigan to enhance their market presence and performance.
Competitive Landscape
In the Massachusetts edible market, Dorks has shown a notable improvement in its ranking from October 2025 to January 2026, climbing from 33rd to 29th position. This upward trend suggests a positive reception among consumers, especially when compared to competitors like Marmas, which remained relatively stagnant, consistently ranking around the low 30s. Meanwhile, Cannatini and Ahh have seen slight fluctuations but generally maintained higher ranks than Dorks throughout this period. Despite these challenges, Dorks' sales have shown resilience, particularly in December 2025 and January 2026, where sales figures rebounded significantly from the November dip. This indicates a potential strategic shift or successful marketing efforts that could be capitalized on to further improve its market position against established brands like Jams, which also experienced a decline in January 2026.
Notable Products
In January 2026, the top-performing product for Dorks was Choice Chews x Dorks Geeky Grape Gummies Clusters 20-Pack, which climbed to the number one spot with notable sales of 1812 units. Following closely, Choice Chews x Dorks Brainiac Berry Cherry Cluster Gummies 20-Pack secured the second position, improving from its previous fifth place in November 2025. Choice Chews x Dorks Nerd Berry Cluster Gummies 20-Pack, which held the top rank in December 2025, slipped to third place. The Dweeby Blue Razz Gummy Clusters maintained a consistent presence, ranking fourth in January 2026. Meanwhile, Brainiac Berry Cherry Gummies Clusters 10-Pack re-entered the top five, marking its return after missing out in December 2025.
Top Selling Cannabis Brands
Data for this report comes from real-time sales reporting by participating cannabis retailers via their point-of-sale systems, which are linked up with Headset’s business intelligence software. Headset’s data is very reliable, as it comes digitally direct from our partner retailers. However, the potential does exist for misreporting in the instance of duplicates, incorrectly classified products, inaccurate entry of products into point-of-sale systems, or even simple human error at the point of purchase. Thus, there is a slight margin of error to consider. Brands listed on this page are ranked in the top twenty within the market and product category by total retail sales volume.

