May-2026
Sales
Trend
6-Month
Product Count
SKUs
Avg Price
YoY Sales Change
YoY Price Change
Market Insights Snapshot
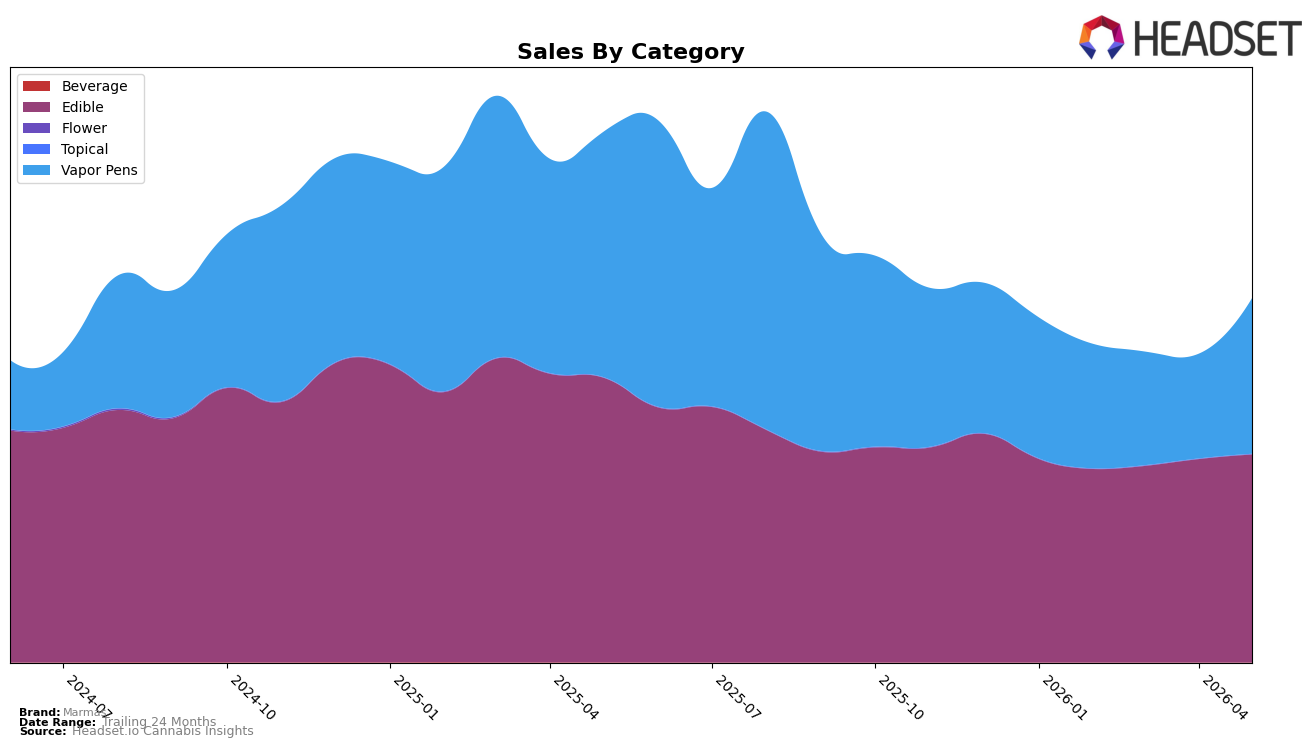
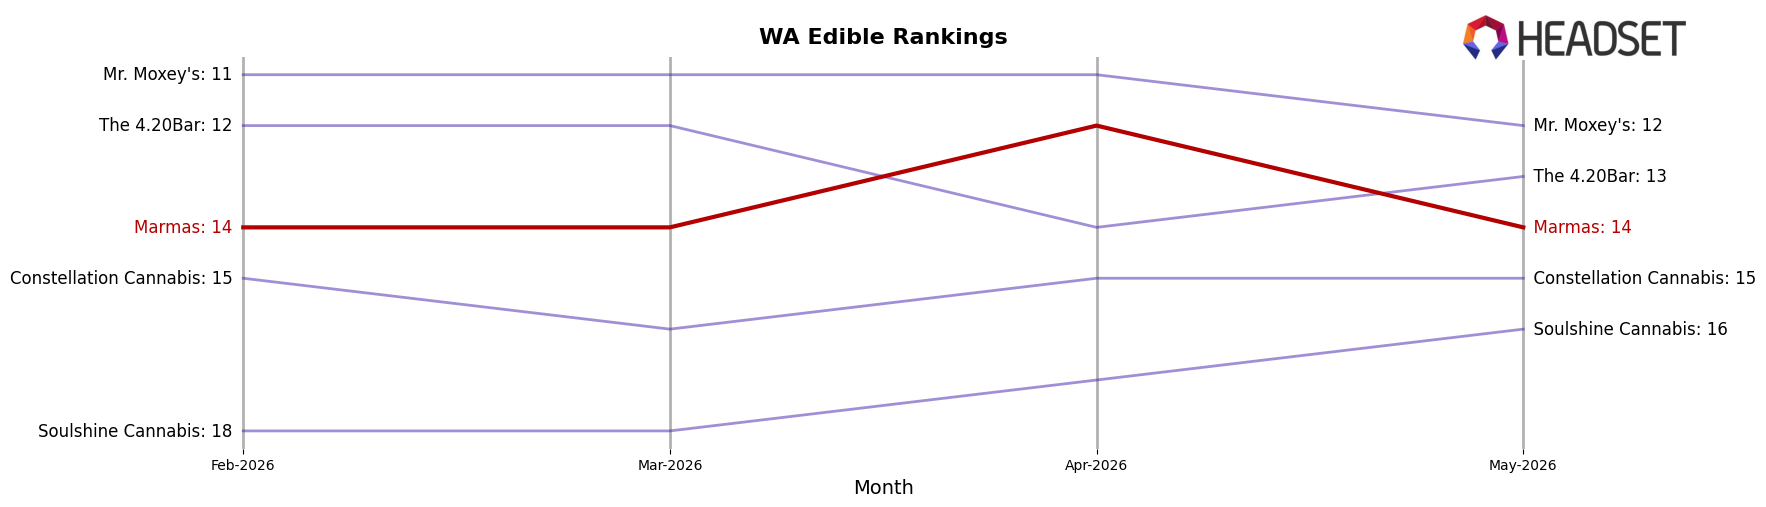
In May 2026, Marmas concentrated 57.19% of sales in Edible with a month-over-month change of 2.24% and a year-over-year decline of 26.96%, while Vapor Pens held 42.77% share with a 48.75% MoM surge but a 36.62% YoY drop; Flower was negligible at 0.04% share with a 212.93% MoM spike from a low base. The Edible average price was up 1.57% YoY at $15.46 overall, contrasting with the Vapor Pens average price at 23.13, yet overall brand sales fell 31.42% YoY alongside a 28.48% gain over 24 months; the mix suggests Marmas is leaning back into Vapor Pens momentum without reversing the longer YoY contraction. Marmas ranked 14 in Edible in Washington, indicating mid-pack traction even as Edible share remains above 57%, implying category balance is shifting tactically toward faster-moving Vapor Pens while Edible anchors distribution.
The 48.75% MoM lift in Vapor Pens against a 2.24% MoM rise in Edible, paired with a 36.62% YoY decline in Vapor Pens versus a 26.96% YoY decline in Edible, implies Marmas is trading short-term velocity for segments with higher price points while ceding year-over-year depth. With Edible at 57.19% share and Vapor Pens at 42.77%, the portfolio tilts toward a dual-pillar stance where rank 14 in Washington Edible provides baseline visibility, but recovery likely hinges on converting Vapor Pens’ near-term MoM gains into sustained share without overexposing to a category still down YoY; the pattern points to prioritizing cross-category shopper migration to stabilize total sales despite a 31.42% YoY brand decline.
Competitive Landscape
Marmas sits at rank #14 in WA Edible in May 2026, down 3 positions year over year from #11, while holding flat versus 3 months ago at #14; that slippage from its peak at #11 in May 2025 contrasts with Wyld holding #1 year over year with a 26.5% YoY sales lift and Green Revolution steady at #2 with a 15.8% YoY increase, indicating Marmas is losing relative momentum despite category leaders expanding. Against mid-pack movers, Hot Sugar remained #3 despite an 8.1% YoY sales decline and Craft Elixirs stayed #5 with a 6.4% drop, yet Marmas still fell 3 ranks year over year while its 3‑month rank stayed unchanged at #14, implying the brand’s trajectory reflects stagnant share amid competitors consolidating positions even when some are shrinking.
Notable Products
Indica Huckleberry Gummies 10-Pack (100mg) posted the steepest movement, down 16.96% MoM to rank 3 while Tranqility - CBD/THC 4:1 Huckleberry Marmalade Candy Bites 10-Pack (400mg CBD, 100mg THC) retained rank 1 despite a 4.44% dip. Across the top 10, eight are Edible SKUs, and within that set functional formulations diverged, with Sleep - CBN/THC 1:2 Concord Grape Gummies 20-Pack (50mg CBN, 100mg THC) up 4.93% at rank 5 while CBD:THC 20:1 Asian Pear Marmalade Candies Bites 10-Pack (200mg CBD, 10mg THC) slipped 5.11% at rank 6. The lone non-Edible in the group, Kiwi Strawberry BHO Distillate Disposable (0.5g), entered at rank 8 with $24,160 and no prior-month comp, contrasting the modest 0.51% and 2.32% gains seen by flavor-led gummies at ranks 4 and 9. The pattern implies Marmas is tilting toward functional Edibles for volume while testing a single Vapor Pens beachhead for incremental reach, with volatility concentrated in legacy fruit flavors rather than ratio-led offerings.
Top Selling Cannabis Brands
Data for this report comes from real-time sales reporting by participating cannabis retailers via their point-of-sale systems, which are linked up with Headset’s business intelligence software. Headset’s data is very reliable, as it comes digitally direct from our partner retailers. However, the potential does exist for misreporting in the instance of duplicates, incorrectly classified products, inaccurate entry of products into point-of-sale systems, or even simple human error at the point of purchase. Thus, there is a slight margin of error to consider. Brands listed on this page are ranked in the top twenty within the market and product category by total retail sales volume.

