.svg)

Sep-2026
Sales
Trend
6-Month
Product Count
SKUs
Avg Price
YoY Sales Change
YoY Price Change


Where to Buy
Muncheas is stocked at 41 licensed dispensaries across Massachusetts, with the deepest coverage in Boston, Fall River, Lowell, Northampton, and Quincy. Search by ZIP code or city below to find the closest one.
Market Insights Snapshot
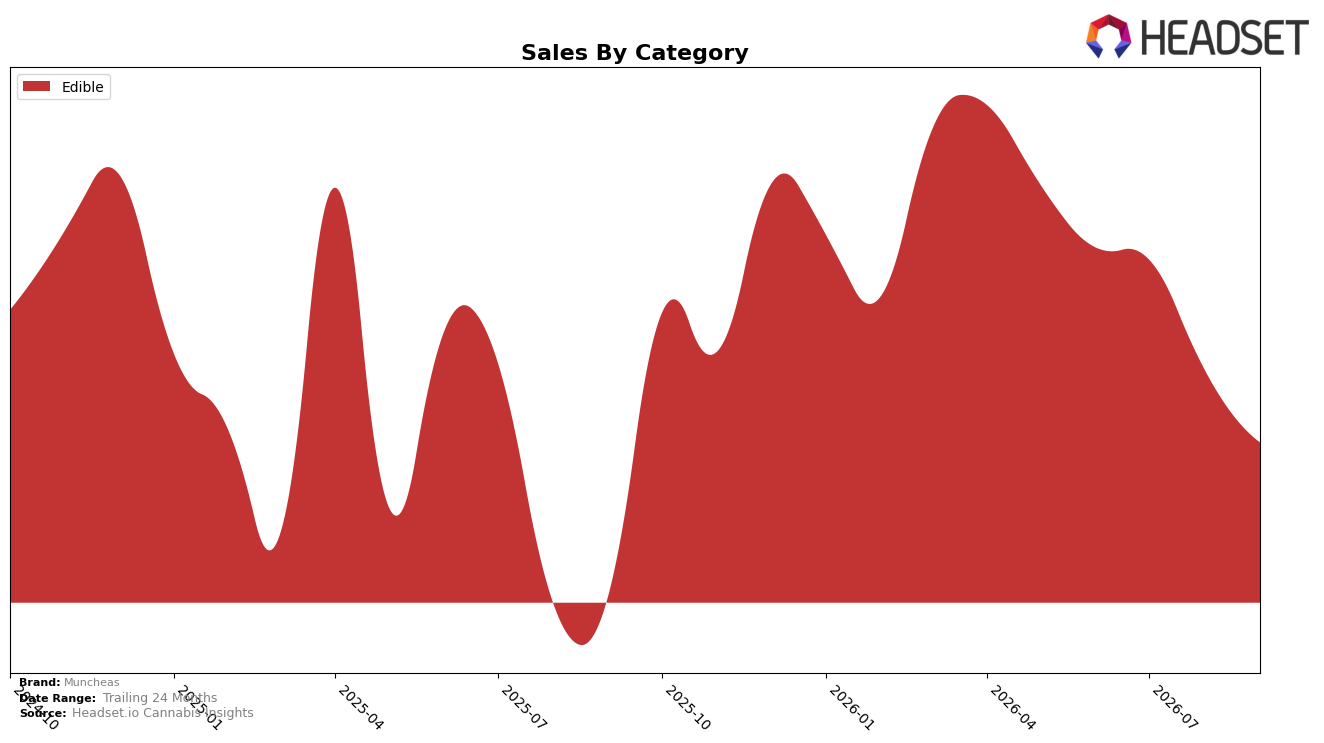
In September 2026, Muncheas operated as a single-category brand with Edible at 100.0% of sales share, posting 21.9% year-over-year growth alongside a 7.8% month-over-month decline, and holding rank 25 in Massachusetts Edible. The 40.7% year-over-year drop in average price to $5.90 coincided with a 36.9% two-year sales increase, indicating price elasticity at work and a trade-down shift within Edible rather than category diversification.
The mix concentration at 100.0% in Edible, combined with a fall to 7.8% month over month and a rank position of 25, implies Muncheas is leaning on price-led volume within a mid-pack slot rather than expanding into other categories. The 21.9% year-over-year sales increase alongside a 40.7% price decrease and a 36.9% two-year lift suggests the current positioning relies on being a value option in Edible, which can win share during price-sensitive periods but leaves headroom limited unless unit velocity improves or mix broadens.
Competitive Landscape
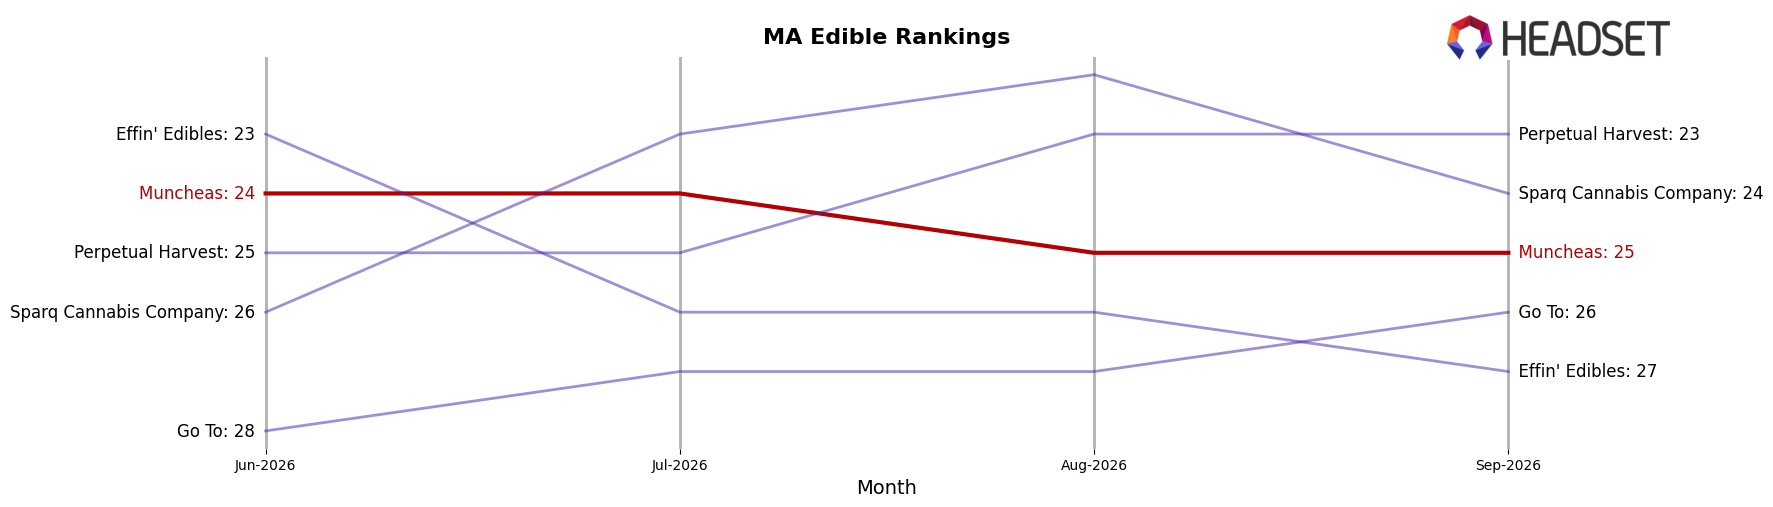
Muncheas sits at rank #25 in MA Edible for September 2026, down 1 position year over year from #24, and flat versus June 2026 at #24, while the brand’s peak at #20 in October 2025 marks a 5-rank slide since that high; by contrast, Camino climbed from #3 to #1 and Wyld improved from #4 to #3 alongside an 11.8% YoY sales lift, indicating Muncheas is ceding relative rank share to faster-moving leaders even without a sharp short-term drop. The combination of a 1-rank YoY decline and no quarter-on-quarter gain, against competitors that moved up 1–2 ranks with YoY sales changes ranging from -1.1% to +34.8%, implies a stagnant trajectory that, if unchanged, will likely keep Muncheas outside the top 20 through the next cycle.
Notable Products
Tropical Fruit Gems Gummies 20-Pack (100mg) posted the standout move in September 2026 with +68.0% MoM, climbing to rank 2 while Watermelon Fruit Gems Gummies 20-Pack (100mg) fell -28.7% MoM at rank 4, and Cran-Grape Fruit Gems Gummies 20-Pack (100mg) sank -69.4% MoM at rank 5. Cherry Fruit Gems Gummies 20-Pack (100mg) held rank 1 with +26.6% MoM and $15,185 in sales, whereas Lemon Fruit Gems Gummies 20-Pack (100mg) slipped -18.9% MoM to rank 10. With all top 10 SKUs in Edible gummies and multiple flavor variants concentrated in the Fruit Gems family, the mix points to a flavor-rotation dynamic where a few surging flavors drive share while underperformers quickly cede rank, implying agile SKU management over broad-line expansion.
Top Selling Cannabis Brands






Data for this report comes from real-time sales reporting by participating cannabis retailers via their point-of-sale systems, which are linked up with Headset’s business intelligence software. Headset’s data is very reliable, as it comes digitally direct from our partner retailers. However, the potential does exist for misreporting in the instance of duplicates, incorrectly classified products, inaccurate entry of products into point-of-sale systems, or even simple human error at the point of purchase. Thus, there is a slight margin of error to consider. Brands listed on this page are ranked in the top twenty within the market and product category by total retail sales volume.

