May-2026
Sales
Trend
6-Month
Product Count
SKUs
Avg Price
YoY Sales Change
YoY Price Change
Market Insights Snapshot
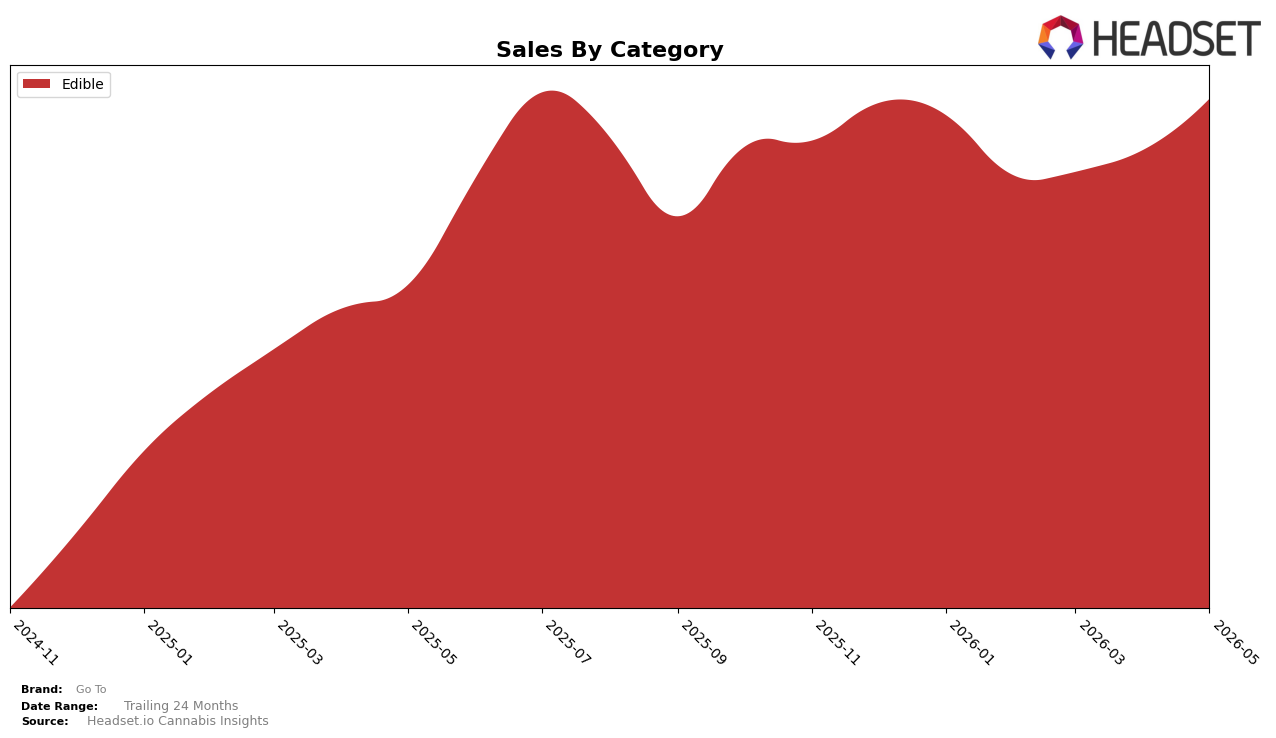
In May 2026, Go To operated as a single-category brand, with Edible representing 100.0% of sales and posting 47.1% year-over-year growth alongside a 9.6% month-over-month lift, while average price declined 10.5% year-over-year. The brand’s Edible position ranked 28 in Massachusetts, indicating room within the ladder despite the double-digit MoM velocity and double-digit YoY expansion; the pattern implies volume gains are offsetting price compression, concentrating performance risk and upside in one category.
The combination of a 10.5% YoY price decline and 47.1% YoY sales expansion, together with a 9.6% MoM uptick, implies unit-led growth driven by Edible availability, pack architecture, or promotional intensity rather than price-led premiumization, and the 28 rank suggests mid-pack visibility rather than top-tier pull. With 100.0% of mix in Edible and no diversification buffer, the brand’s positioning leans into scale within a single format where share gains will rely on sustained unit throughput and controlled discounting rather than cross-category migration.
Competitive Landscape
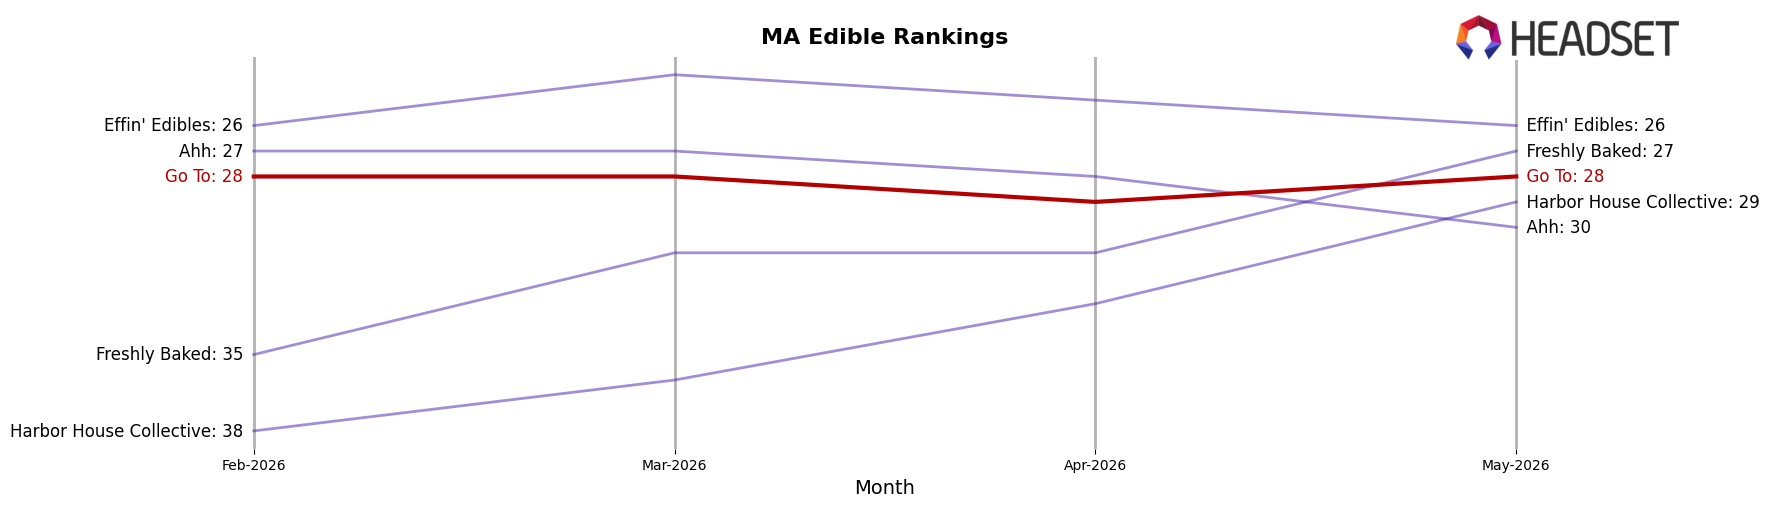
Go To sits at rank #28 in MA Edible in May 2026, improving 10 positions from #38 year over year, while holding flat versus February 2026 at #28 and remaining two spots below its peak #26 from January 2026; in contrast, Kanha / Sunderstorm moved from #2 to #1 with 10.98% YoY sales growth and Wyld advanced from #5 to #3 alongside 36.65% YoY growth, indicating that Go To’s rank gains are occurring amid faster top-tier momentum. With Betty's Eddies holding #4 but posting a -8.90% YoY decline and Coast Cannabis Co. edging from #6 to #5 on 11.44% YoY growth, the mix at the top is tightening, and Go To’s +10-place YoY rise coupled with a two-rank gap to its January 2026 peak implies a stabilization phase where incremental distribution or SKU productivity shifts, rather than step-change velocity, are likely to determine its next move.
Notable Products
Sour Apple Gummies 20-Pack (100mg) led May 2026 with a 58.7% month-over-month surge to rank 1, while Jalapeno Pineapple Gummy 20-Pack (100mg) collapsed 94.7% and slid to rank 6, marking the steepest decline. Blueberry Gummies 20-Pack (100mg) held rank 2 with an 8.1% lift, and Cranberry Lime Gummies 20-Pack (100mg) advanced 26.2% at rank 3, while Lemon Lime Gummies 20-Pack (100mg) was flat to down 0.5% at rank 5. Four of the top five SKUs are Edible gummies from the same family, and the category concentration alongside the outsized 58.7% gain at rank 1 and the 94.7% drop at rank 6 implies Go To is consolidating around mainstream flavors while pruning or deprioritizing niche heat-forward variants.
Top Selling Cannabis Brands
Data for this report comes from real-time sales reporting by participating cannabis retailers via their point-of-sale systems, which are linked up with Headset’s business intelligence software. Headset’s data is very reliable, as it comes digitally direct from our partner retailers. However, the potential does exist for misreporting in the instance of duplicates, incorrectly classified products, inaccurate entry of products into point-of-sale systems, or even simple human error at the point of purchase. Thus, there is a slight margin of error to consider. Brands listed on this page are ranked in the top twenty within the market and product category by total retail sales volume.

