Market Insights Snapshot
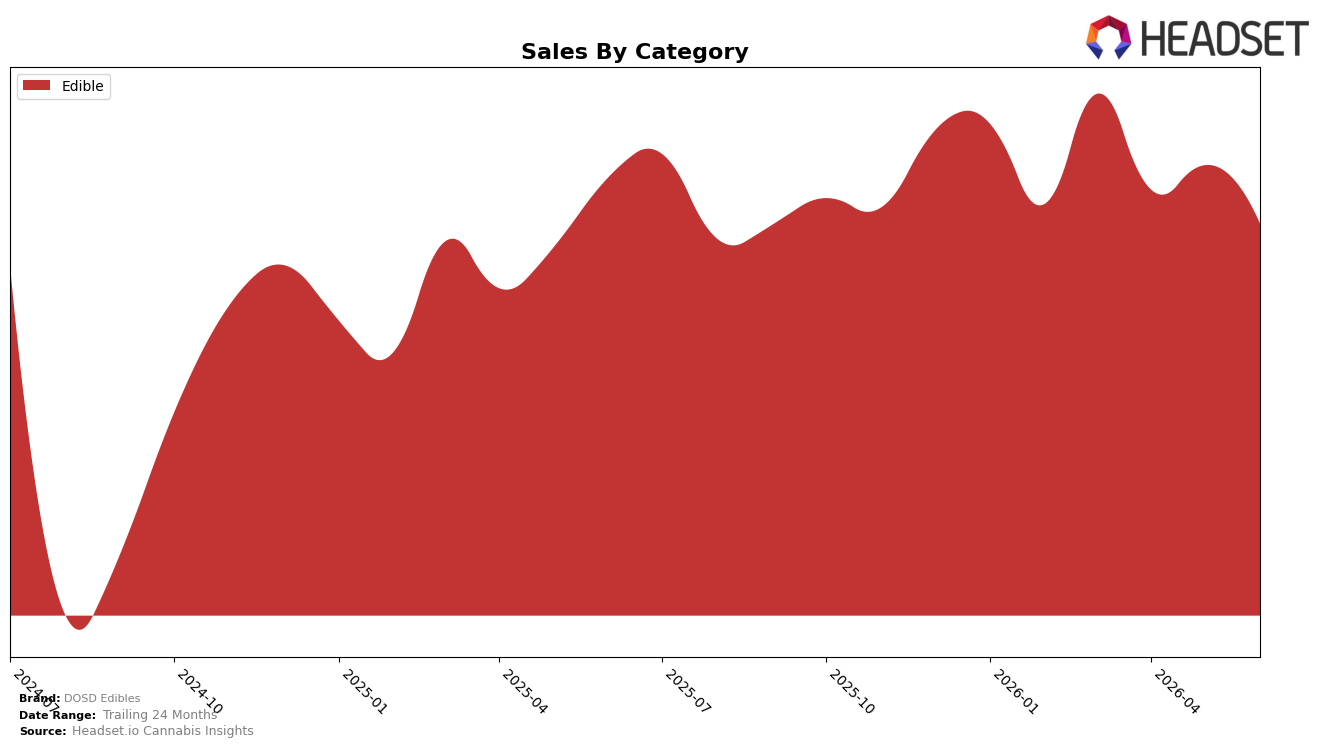
In June 2026, DOSD Edibles operated as a single-category brand with Edible accounting for 100.0% of sales, while category sales declined 7.59% year over year and fell 9.42% month over month. Within the Missouri Edible segment, the brand held rank 9, and its average price rose 11.03% YoY to $22.23 as volume softened in tandem with the 7.59% sales contraction. The conjunction of an all-Edible mix at 100.0% and a rank of 9 implies concentration risk: with no buffer from other categories, the −9.42% MoM dip directly transmits into overall performance, suggesting that near-term share stability depends on price-to-volume trade-offs inside a single lane.
The pricing lift of 11.03% alongside a 7.59% YoY sales decline positions DOSD Edibles as a mid-pack player (rank 9) that is leaning on price while ceding some velocity, and the −9.42% MoM shows limited insulation from monthly demand shocks. Given the 100.0% category reliance, maintaining or improving rank 9 in Missouri will likely require balancing price with promotional depth to recover unit throughput, because any further volume erosion inside Edibles amplifies total-brand volatility; the pattern implies the brand’s positioning hinges on optimizing value perception within Edibles rather than diversification.
Competitive Landscape
DOSD Edibles ranks #9 in MO Edible in June 2026, improving 1 position from #10 year over year and up 1 spot from #10 in March 2026, while also marking a peak rank of #9 in June 2026; in contrast, Good Day Farm advanced from #4 to #2 with a 19.4% year-over-year sales increase as Smokiez Edibles fell from #2 to #5 alongside a 23.4% decline, and category leader Gron / Grön held #1 despite a 13.1% contraction while Wyld stayed at #3 with a 2.2% dip; this pattern implies DOSD Edibles is edging into the top tier through incremental rank gains as incumbents at the top reshuffle and some leaders contract.

Notable Products
Nano Bites - Pinkburst Gummies 10-Pack (100mg) posted the steepest decline in June 2026 at -32.9% MoM, sliding to rank 2 while Nano Bites - Mixed Fruit Gummies 10-Pack (100mg) edged down -8.8% but held rank 1. Across the top ten, eight SKUs carry the Nano Bites family, yet several core variants contracted, including Nano Bites - Ozark Dew Gummies 10-Pack (100mg) at -47.3% MoM in rank 10 and the CBD/THC 1:1 Pina Colada at -14.7% in rank 6, implying flavor fatigue and dosage-format reliance rather than incremental trial. The mid-pack stability of Night Vibes - THC/CBN 1:1 Blue Raspberry Gummies 10-Pack (100mg THC, 100mg CBN) at -2.9% MoM in rank 5 versus Night Vibes - CBD/THC 1:1 Blue Raspberry at -24.8% in rank 4 suggests demand concentrating around sleep-oriented CBN while general wellness CBD blends slip. Taken together, concentration in a single gummy platform with mixed MoM signals points to a need for fewer overlapping flavors and more function-forward differentiation to sustain DOSD Edibles’s growth trajectory.
Top Selling Cannabis Brands
Data for this report comes from real-time sales reporting by participating cannabis retailers via their point-of-sale systems, which are linked up with Headset’s business intelligence software. Headset’s data is very reliable, as it comes digitally direct from our partner retailers. However, the potential does exist for misreporting in the instance of duplicates, incorrectly classified products, inaccurate entry of products into point-of-sale systems, or even simple human error at the point of purchase. Thus, there is a slight margin of error to consider. Brands listed on this page are ranked in the top twenty within the market and product category by total retail sales volume.

