Jun-2026
Sales
Trend
6-Month
Product Count
SKUs
Avg Price
YoY Sales Change
YoY Price Change
Market Insights Snapshot
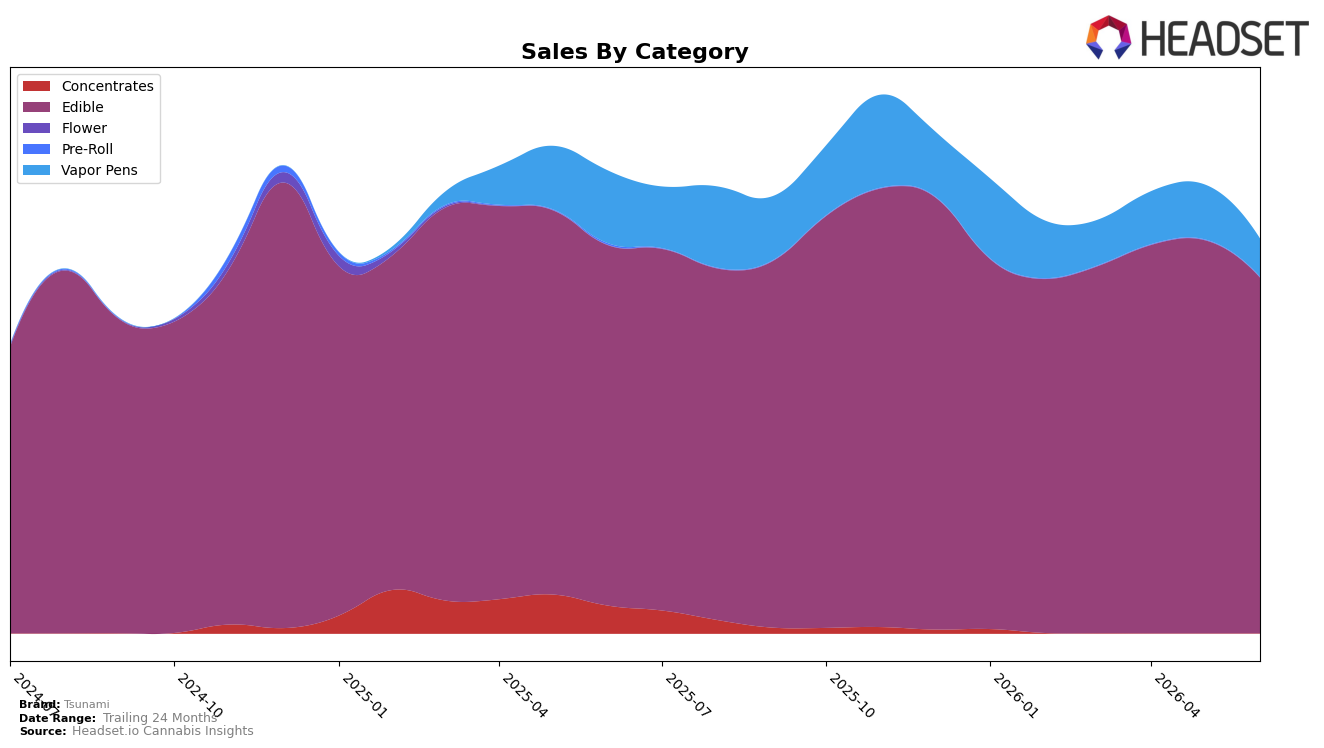
Tsunami’s mix in June 2026 concentrated 90.37% of sales in Edible with a rank of 11 in Edible in Missouri, while Vapor Pens held 9.63% share; Edible declined 1.26% year over year and 9.51% month over month, whereas Vapor Pens fell 47.63% year over year and 30.49% month over month. Against a brand-level sales change of -14.71% year over year and an average price down 27.97%, the shallower Edible contraction versus Vapor Pens implies the current portfolio is skewed toward the relatively steadier category and away from the sharper declines, indicating a defensive category tilt despite month-over-month pressure.
With Edible averaging $43.49 and Vapor Pens at $51.15 alongside a brand average of $44.13, the price ladder positions Edible as the volume anchor while Vapor Pens sits as a smaller, higher-price pocket; the 9.51% month-over-month pullback in Edible versus a 30.49% drop in Vapor Pens signals mix headwinds more from the accessory category than the core. Coupled with a 24‑month brand sales increase of 40.02% and an 11th-place Edible rank in Missouri, the pattern implies Tsunami’s near-term positioning rests on stabilizing Edible retention and selectively pruning Vapor Pens exposure to protect rank and share while price resets run through the base.
Competitive Landscape
Tsunami sits at rank #11 in MO Edible in June 2026, a 1-position improvement from #12 year over year, and a 1-position gain from #12 three months ago; against this, the brand’s peak of #7 in December 2024 marks a 4-rank slide from its best point. Competitors are moving unevenly: Good Day Farm advanced from #4 to #2 while growing sales 19.37% year over year, and Smokiez Edibles fell from #2 to #5 alongside a 23.35% sales decline; meanwhile, category leader Gron / Grön held #1 but contracted 13.10%, and Good Taste climbed from #8 to #4 with 65.34% growth. The mix of upward mobility among mid-pack rivals and contraction at the top implies Tsunami’s modest rank recovery could continue if it captures share from shrinking leaders faster than accelerating climbers gain ground.

Notable Products
Sour Black Cherry Banzai Gummies 10-Pack (2000mg) posted the steepest decline in June 2026 at -27.8% MoM while dropping to rank 8, and Sour Wild Berry Wipeout Gummies 10-Pack (2000mg) fell -15.6% MoM at rank 5, implying heavy-milligram multipacks are shedding momentum even as overall ranks remain in the top 10. By contrast, Strawberry Surge Gummies 10-Pack (1000mg) climbed +184.1% MoM to rank 1 with approximately $48,563 in sales, while Pink Drink Swells Gummy (100mg) slid -50.9% MoM at rank 2, signaling a bifurcation between a single breakout SKU and broad softness elsewhere. Eight of the top ten are Edible SKUs concentrated in gummy formats, and rank stability at 4 through 7 alongside -7.9% and -20.4% MoM changes indicates share is consolidating around fewer winners rather than lifting the whole set. The pattern implies Tsunami’s commercial direction is shifting toward a hero-led gummy portfolio where one 1000mg format drives visibility while higher-dosage multipacks and several 100mg Swells entries face demand compression.
Top Selling Cannabis Brands
Data for this report comes from real-time sales reporting by participating cannabis retailers via their point-of-sale systems, which are linked up with Headset’s business intelligence software. Headset’s data is very reliable, as it comes digitally direct from our partner retailers. However, the potential does exist for misreporting in the instance of duplicates, incorrectly classified products, inaccurate entry of products into point-of-sale systems, or even simple human error at the point of purchase. Thus, there is a slight margin of error to consider. Brands listed on this page are ranked in the top twenty within the market and product category by total retail sales volume.

