Market Insights Snapshot
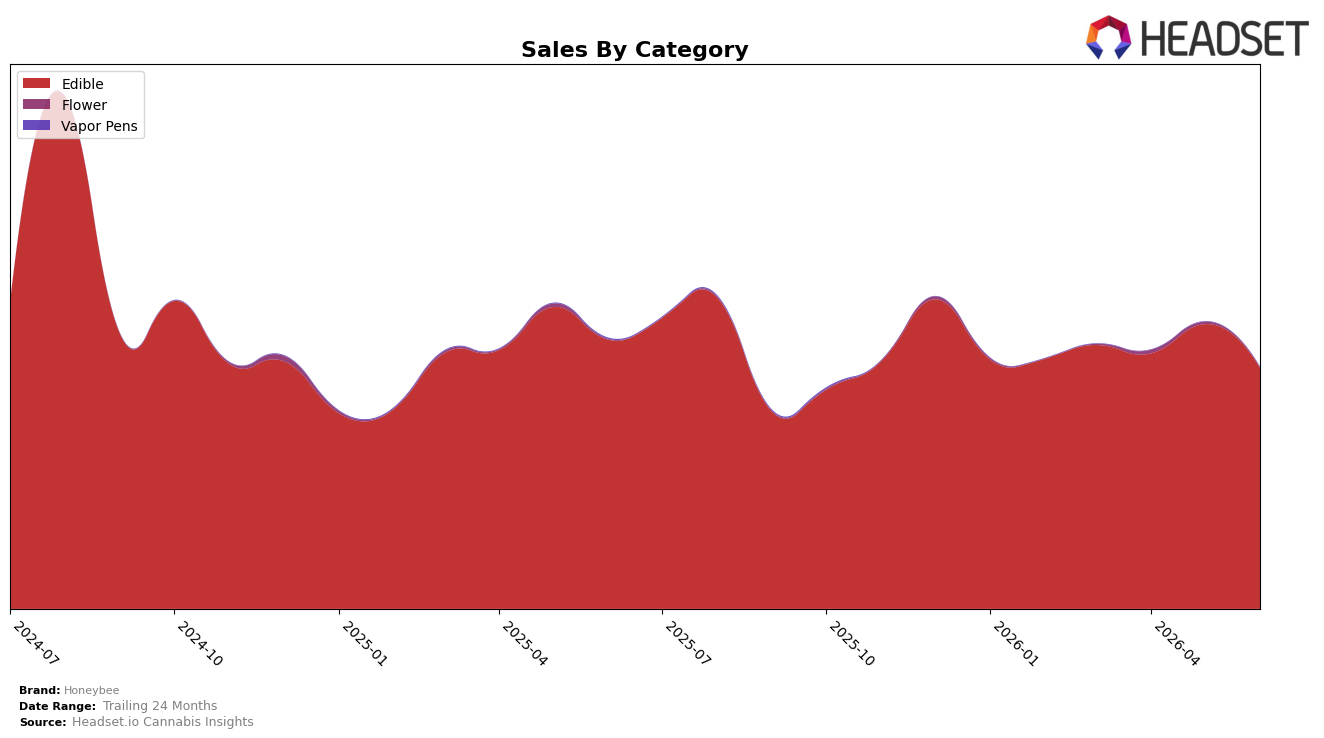
Honeybee is concentrated in Edible, holding 99.77% category share in June 2026 while Flower accounts for 0.23%, and this narrow mix coincides with an Edible year-over-year change of -10.52% and month-over-month change of -15.41%. Flower posted a contrasting +4.37% year-over-year but plunged -72.59% month-over-month, indicating that the tiny diversification is unstable at a micro scale; paired with a -15.42% average price change year-over-year and a brand-level -10.70% sales year-over-year, the pattern implies price-led compression within the core category that is not being offset by secondary categories.
With a June 2026 Edible rank of 12 in Missouri and a 99.77% reliance on Edible, Honeybee’s positioning hinges on recovering momentum in the core rather than expanding breadth, because the -15.41% month-over-month in Edible outweighs the 0.23% share exposure to Flower. The divergence between a -10.52% Edible year-over-year and a +4.37% Flower year-over-year, combined with a -72.59% Flower month-over-month, implies that experimenting outside Edible adds volatility without material share impact; sustaining rank 12 will likely depend on stabilizing Edible price and mix more than pursuing incremental Flower gains.
Competitive Landscape
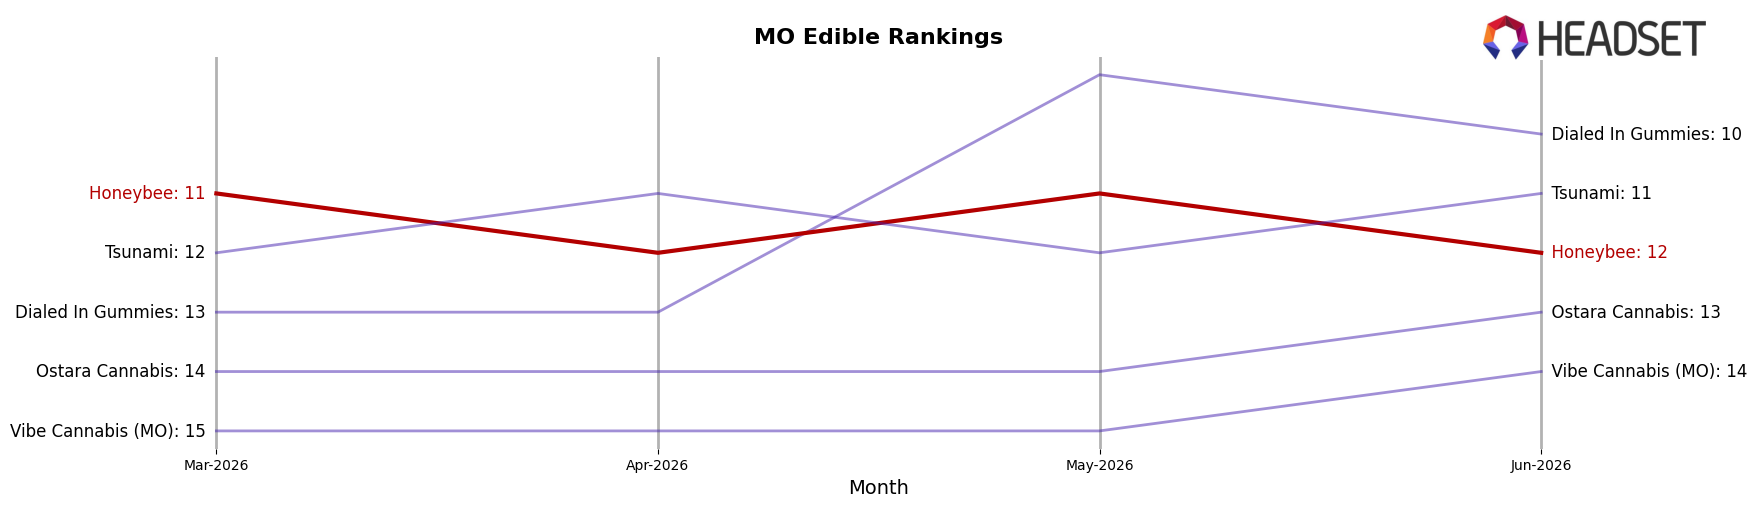
Honeybee sits at rank #12 in MO Edible for June 2026, down 1 position year over year from #11 and down 1 position versus March 2026 when it was #11; the brand’s historical ceiling of #6 in August 2024 sets a reference point that is 6 places higher than today and 5 places higher than March 2026. Competitive movement is bifurcated: Good Day Farm climbed from #4 to #2 alongside a 19.4% YoY sales increase while Smokiez Edibles fell from #2 to #5 amid a 23.4% YoY decline; meanwhile, category leader Gron / Grön held #1 but with a 13.1% YoY sales contraction as Good Taste advanced from #8 to #4 on 65.3% YoY growth. The juxtaposition of Honeybee’s 1-rank YoY slip with peers moving sharply up or down implies Honeybee is stuck in a middle tier where modest share erosion risks being amplified unless it reconnects to the momentum that once supported a #6 peak.
Notable Products
Queen Bee - Black Cherry Cola Gumdrop (100mg) posted the steepest decline in June 2026 at -29.9% MoM while sliding to rank 5, and Grape Soda Gumdrops 20-Pack (100mg) also fell -24.8% MoM at rank 7; together with Queen Bee - CBD/THC 1:1 Blue Raspberry Gumdrop (100mg THC, 100mg CBD) at -25.1% MoM and rank 10, the depth of declines was concentrated in single-serve or niche variants rather than the core multipacks. The flagship Black Cherry Cola Gumdrops 20-Pack (100mg) stayed at rank 1 despite a -14.1% MoM drop, and Blood Orange Strawberry Gumdrops 20-Pack (100mg) held rank 2 with a softer -3.6% MoM, while four of the top ten are Queen Bee-branded SKUs indicating a branded sub-line concentration; the only raw dollar anchor is $21,883 for the leading SKU. With six of the top ten as Edible gumdrop multipacks and several 1:1 CBD/THC entries debuting at ranks 8–9 with no MoM baselines, the mix points to Honeybee leaning into larger-count gummies and functional CBD/THC pairings even as legacy flavors retrench.
Top Selling Cannabis Brands
Data for this report comes from real-time sales reporting by participating cannabis retailers via their point-of-sale systems, which are linked up with Headset’s business intelligence software. Headset’s data is very reliable, as it comes digitally direct from our partner retailers. However, the potential does exist for misreporting in the instance of duplicates, incorrectly classified products, inaccurate entry of products into point-of-sale systems, or even simple human error at the point of purchase. Thus, there is a slight margin of error to consider. Brands listed on this page are ranked in the top twenty within the market and product category by total retail sales volume.

