Jun-2026
Sales
Trend
6-Month
Product Count
SKUs
Avg Price
YoY Sales Change
YoY Price Change
Market Insights Snapshot
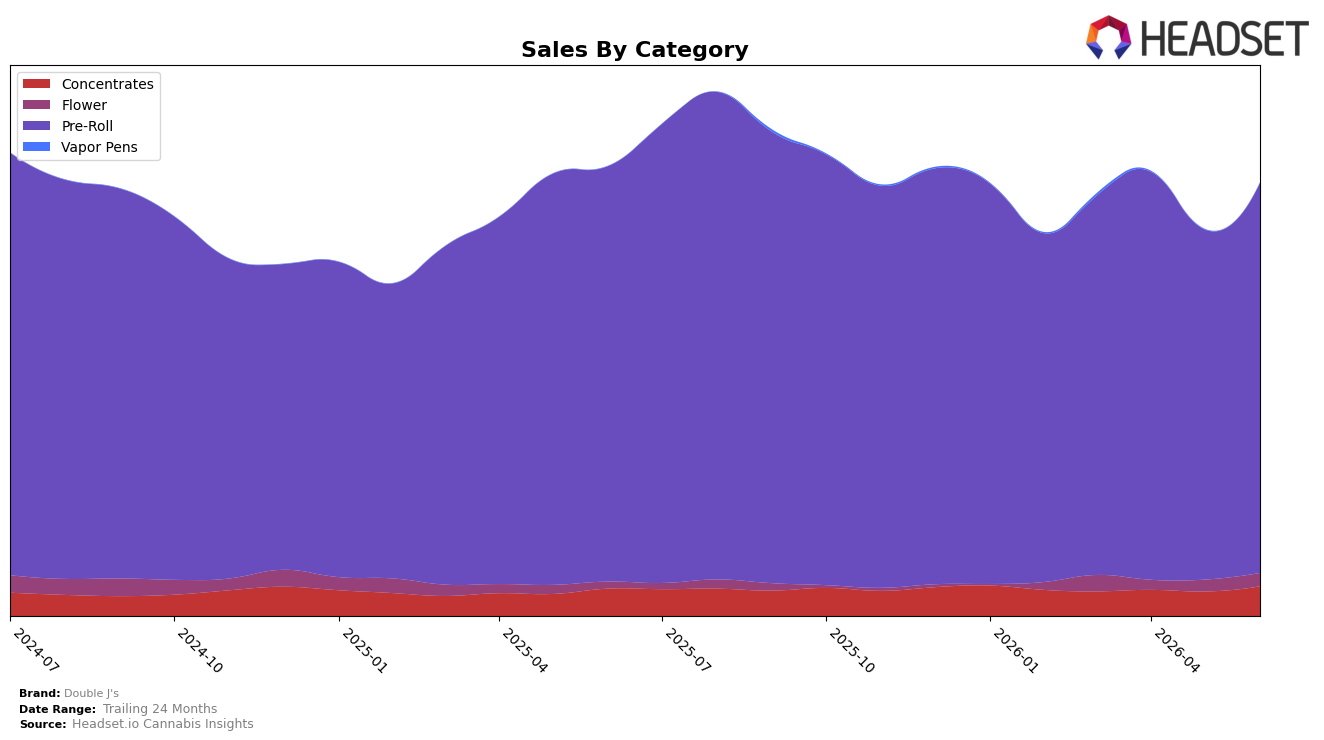
In June 2026, Double J's concentrated 90.18% of sales in Pre-Roll, where sales fell 6.11% year over year but rose 11.43% month over month; Concentrates held 6.83% share with sales up 8.56% YoY and 21.24% MoM; and Flower reached 2.98% share with a 96.76% YoY jump and 13.39% MoM gain. Despite a 6.78% YoY drop in average price to $13.26, overall brand sales declined 3.72% YoY while expanding 8.15% over 24 months, indicating the mix shift and price compression partly offset category-level volume gains. The pattern implies Double J's is leaning on Pre-Roll scale for MoM momentum while newer contributions from Concentrates and Flower are the primary YoY growth offsets to Pre-Roll softness.
With a 90.18% Pre-Roll dependence and a category rank of 25 in Ontario, the 11.43% MoM rebound suggests short-cycle wins are coming from tactical pricing and pack architecture, while the 6.11% YoY decline signals limited headroom at current positioning. The 96.76% YoY growth in Flower and 8.56% in Concentrates, though from small bases of 2.98% and 6.83% share respectively, create optionality to diversify away from price-sensitive Pre-Roll; combined with the 6.78% price decrease, this points to a value-led stance that can defend rank 25 only if the brand translates Concentrates’ 21.24% MoM surge and Flower’s 13.39% MoM lift into sustained share above 10% outside Pre-Roll.
Competitive Landscape
Double J's sits at rank #25 in ON Pre-Roll in June 2026, down 4 positions year over year from #21, and 5 positions below its March 2026 mark of #20; despite a historical peak of #18 in August 2025, the brand has not reclaimed a top-20 slot. In contrast, Back Forty / Back 40 Cannabis climbed from #3 to #1 with 74.6% YoY sales growth, while General Admission slid from #1 to #2 with a -17.9% YoY sales change, indicating leadership churn at the top as Double J's declines 5 ranks from March 2026 to June 2026; this trajectory implies share is consolidating among faster risers and that Double J's needs a catalyst to avoid further mid-pack erosion.

Notable Products
Flavoured Banana Candy Gas Infused Pre-Roll 4-Pack (2g) posted the steepest decline in June 2026 at -41.0% and slipped to rank 10, while Cherry Boat Pre-Roll 20-Pack (10g) delivered the largest MoM gain at +56.3% and rose to rank 5; this divergence implies consumer pivot toward larger pack sizes amid fatigue on niche infused formats. Cherry Boat Pre-Roll 2-Pack (2g) maintained rank 1 with +11.4% MoM alongside TK3k Pre-Roll 2-Pack (2g) at rank 2 with +15.4%, and six of the top ten are Pre-Roll SKUs, concentrating share in convenience-driven formats; taken together, the upswing in both 2-pack and 20-pack options signals a barbell strategy is working in Pre-Rolls while mid-sized novelty packs are losing traction. Star Cab Cherry Chem Pre-Roll 4-Pack (4g) fell -11.8% to rank 4 even as PLG #7 (Pink Lemon Gas) Pre-Roll 4-Pack (4g) grew +22.9% at rank 9, indicating mixed receptivity to 4-pack sizes and flavor profiles; the product mix points to Double J's leaning into core strain equity and extreme pack-size variety to capture both trial and stock-up missions.
Top Selling Cannabis Brands
Data for this report comes from real-time sales reporting by participating cannabis retailers via their point-of-sale systems, which are linked up with Headset’s business intelligence software. Headset’s data is very reliable, as it comes digitally direct from our partner retailers. However, the potential does exist for misreporting in the instance of duplicates, incorrectly classified products, inaccurate entry of products into point-of-sale systems, or even simple human error at the point of purchase. Thus, there is a slight margin of error to consider. Brands listed on this page are ranked in the top twenty within the market and product category by total retail sales volume.

