Jun-2026
Sales
Trend
6-Month
Product Count
SKUs
Avg Price
YoY Sales Change
YoY Price Change
Market Insights Snapshot
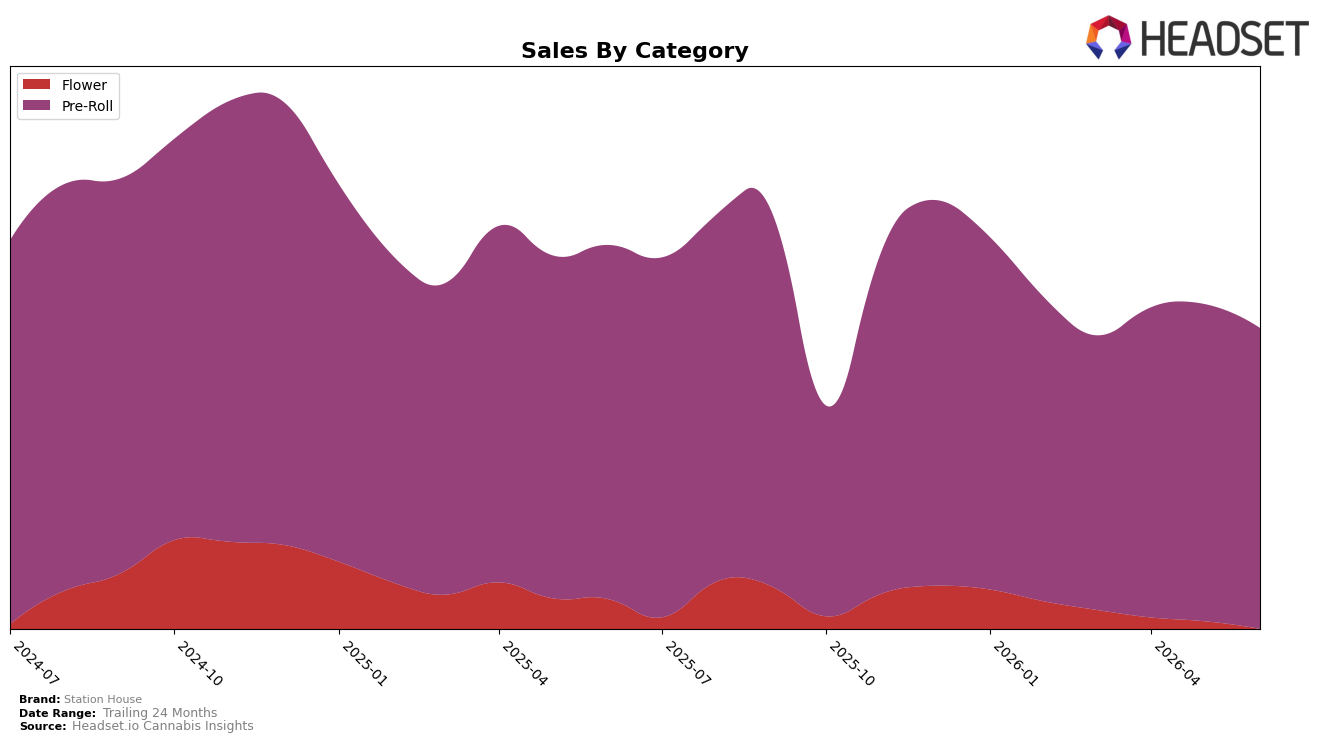
In June 2026, Station House concentrated 87.93% of sales in Pre-Roll, with Flower at 12.07%, while brand-level sales fell 17.32% year over year and 24-month sales were down 6.58%. Within the mix, Pre-Roll declined 13.24% YoY and 4.45% MoM, whereas Flower contracted faster at 38.40% YoY and 13.83% MoM; average price slid 7.05% YoY to $7.70. With Pre-Roll ranked 15th in British Columbia and the top market by sales being Ontario, the pattern implies concentration risk in one category where price compression is ongoing and a smaller, faster-declining Flower line is providing limited diversification.
The sharper drops in Flower (−38.40% YoY, −13.83% MoM) versus Pre-Roll (−13.24% YoY, −4.45% MoM), alongside a 7.05% YoY price decrease and a Pre-Roll share near 88%, suggest Station House is leaning into lower-priced, high-velocity formats to defend volume at the expense of premium positioning. With a 15th-place rank in British Columbia and MoM declines across both categories, the implication is that maintaining relevance requires either reclaiming price/mix in Pre-Roll or reshaping the Flower portfolio, because the current balance pulls the brand toward a value-tier posture without offsetting growth from higher-margin segments.
Competitive Landscape
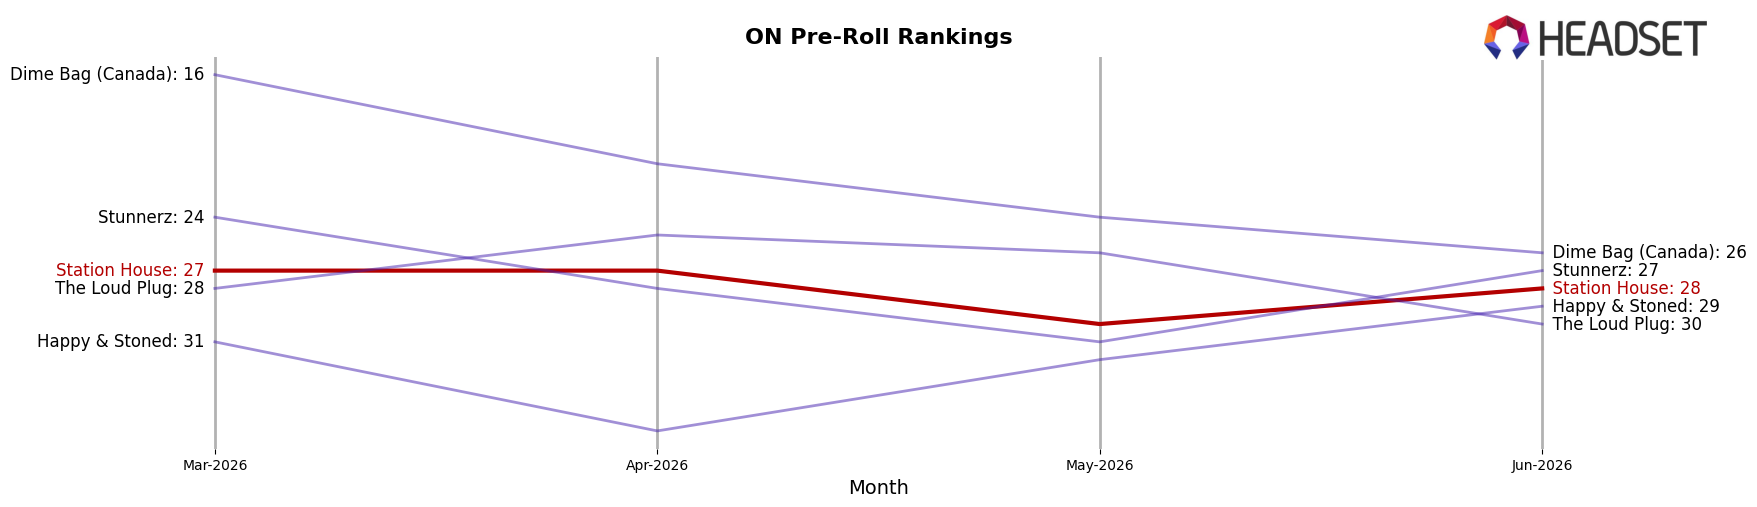
Station House sits at rank #28 in ON Pre-Roll in June 2026, down 1 position YoY from #27, and flat versus March 2026 at #27, while the brand’s peak was #18 in August 2024; in contrast, Back Forty / Back 40 Cannabis climbed to #1 from #3 YoY with a 74.6% sales increase and Thumbs Up Brand advanced to #3 from #8 with 53.6% YoY growth, as Jeeter slid to #4 from #2 alongside a 48.5% YoY sales decline; this combination of a 1-rank YoY slip and stability over the last three months implies Station House is ceding momentum to faster risers and will need a catalyst to reverse a two-year drift from an August 2024 peak of #18.
Notable Products
OG Kush Pre-Roll (0.5g) posted the steepest drop in June 2026 at -19.6% MoM while sliding to rank 4, and Blue Dream Pre-Roll (0.5g) also contracted -11.6% MoM yet held rank 1. In contrast, Sour Diesel Pre-Roll (0.5g) rose +19.4% MoM at rank 6, and Pink Kush Pre-Roll (0.5g) gained +8.9% MoM at rank 3. With nine of the top ten SKUs in Pre-Roll, the tilt toward ready-to-use formats implies Station House is prioritizing pre-roll scale over breadth, accepting declines at the top to back mid-pack momentum.
Top Selling Cannabis Brands
Data for this report comes from real-time sales reporting by participating cannabis retailers via their point-of-sale systems, which are linked up with Headset’s business intelligence software. Headset’s data is very reliable, as it comes digitally direct from our partner retailers. However, the potential does exist for misreporting in the instance of duplicates, incorrectly classified products, inaccurate entry of products into point-of-sale systems, or even simple human error at the point of purchase. Thus, there is a slight margin of error to consider. Brands listed on this page are ranked in the top twenty within the market and product category by total retail sales volume.

