Market Insights Snapshot
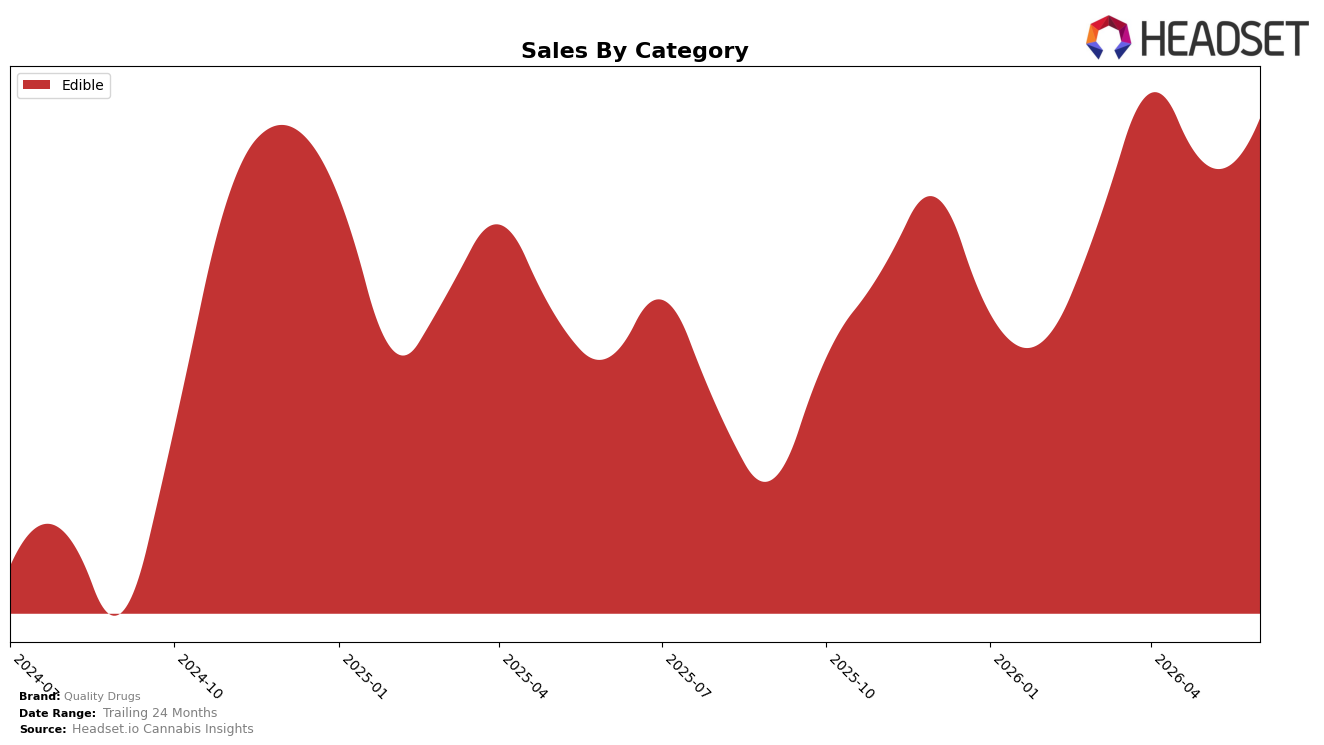
In June 2026, Quality Drugs concentrated entirely in Edible, with category mix share at 100.0% and a category rank of 9 in Oregon. Within this single-category footprint, year-over-year sales rose 34.99% while month-over-month sales increased 5.12%, paired with a 9.36% YoY decline in average price to $6.04. The pattern implies the brand is leaning into price elasticity within Edibles to expand volume, using a full-category focus to sustain mid‑table placement at rank 9 while trading margin for incremental share momentum.
This narrowing to one category raises positioning clarity but also heightens exposure to Edible-specific price cycles: a 9.36% YoY price cut alongside a 34.99% YoY sales increase suggests a value-led stance, and a 5.12% MoM lift indicates short-term velocity can be maintained without diversifying beyond Edibles. Holding rank 9 in Oregon while operating at a 100.0% Edible mix signals the brand’s current edge comes from price-accessibility rather than portfolio breadth, implying future gains will depend on sustaining sub-$6.10 price points and improving unit throughput faster than category peers at adjacent ranks.
Competitive Landscape
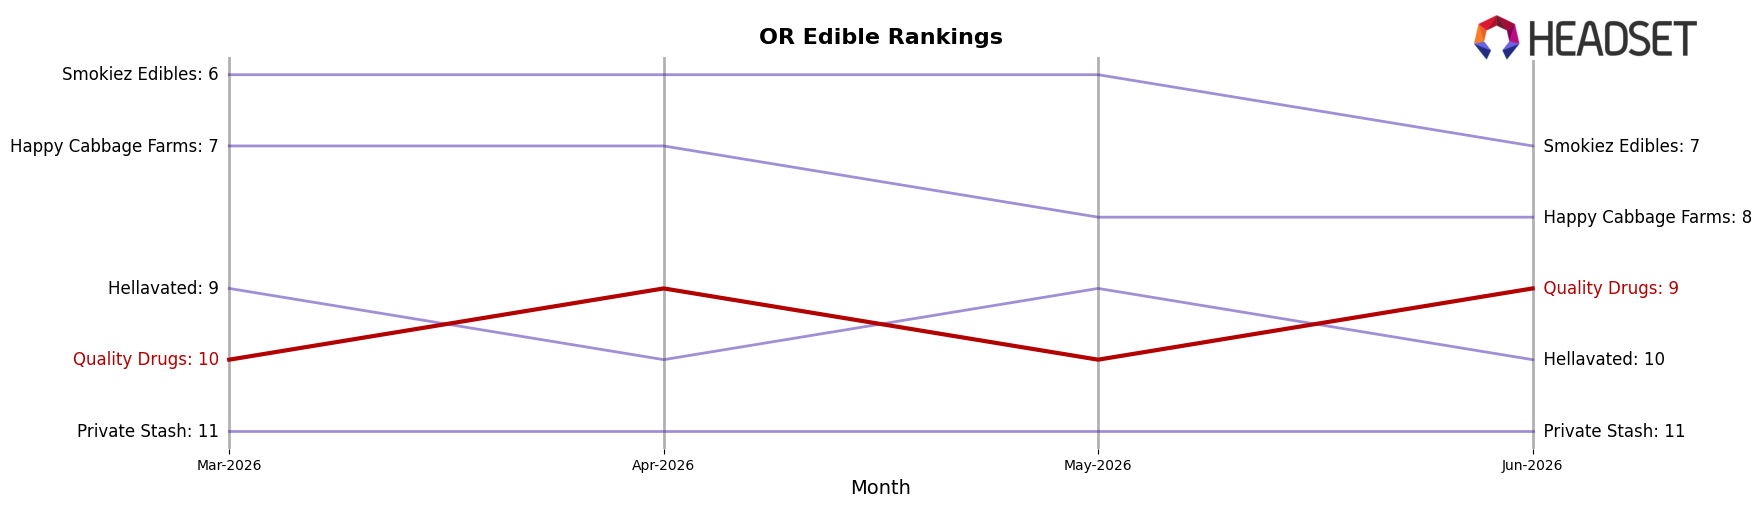
Quality Drugs sits at rank #9 in OR Edible in June 2026, improving 1 position year over year from #10 and rising 1 spot versus March 2026 from #10, while its peak of #8 in April 2025 remains just above the current level. In the same period, Wyld held steady at #1 year over year with an estimated 45% YoY sales growth, and Gron / Grön stayed at #2 despite an estimated 1% YoY sales decline, indicating that Quality Drugs’ incremental gain is occurring beneath a stable top tier; this pattern implies Quality Drugs is inching forward but must break through a relatively fixed top-5 to change trajectory.
Notable Products
Super Sour Apple Gummy (100mg) posted the steepest contraction at -19.98% and slipped to rank 6, while Assorted Fruit Chews 10-Pack (100mg) fell -15.67% to rank 10; in contrast, THC/CBD 2:1 Radiant Raspberry Gummy (100mg THC, 50mg CBD) surged +46.23% to rank 1 with $19,390 in June 2026. Across the top ten, eight SKUs are Edibles occupying ranks 1 through 10, and declines of -11.83% for Assorted Caramels 10-Pack (100mg) at rank 7 alongside a -8.03% dip for Watermelon Gummy (100mg) at rank 3 suggest flavor rotation pressure concentrated in legacy sweets while functional or ratio formats gain share. With Cosmic Pop Gummy (100mg) up +18.66% at rank 2 and CBD/CBN/THC 1:1:1 Berry Bonanza Gumdrops 10-Pack (100mg CBD, 100mg CBN, 100mg THC) up +14.69% at rank 8, the mix tilts toward differentiated formulations despite mixed results among classic fruit SKUs. The pattern implies Quality Drugs is pivoting its Edible portfolio toward ratio and novelty-led offerings to sustain rank leadership while pruning underperforming traditional flavors.
Top Selling Cannabis Brands
Data for this report comes from real-time sales reporting by participating cannabis retailers via their point-of-sale systems, which are linked up with Headset’s business intelligence software. Headset’s data is very reliable, as it comes digitally direct from our partner retailers. However, the potential does exist for misreporting in the instance of duplicates, incorrectly classified products, inaccurate entry of products into point-of-sale systems, or even simple human error at the point of purchase. Thus, there is a slight margin of error to consider. Brands listed on this page are ranked in the top twenty within the market and product category by total retail sales volume.

