Jun-2026
Sales
Trend
6-Month
Product Count
SKUs
Avg Price
YoY Sales Change
YoY Price Change
Market Insights Snapshot
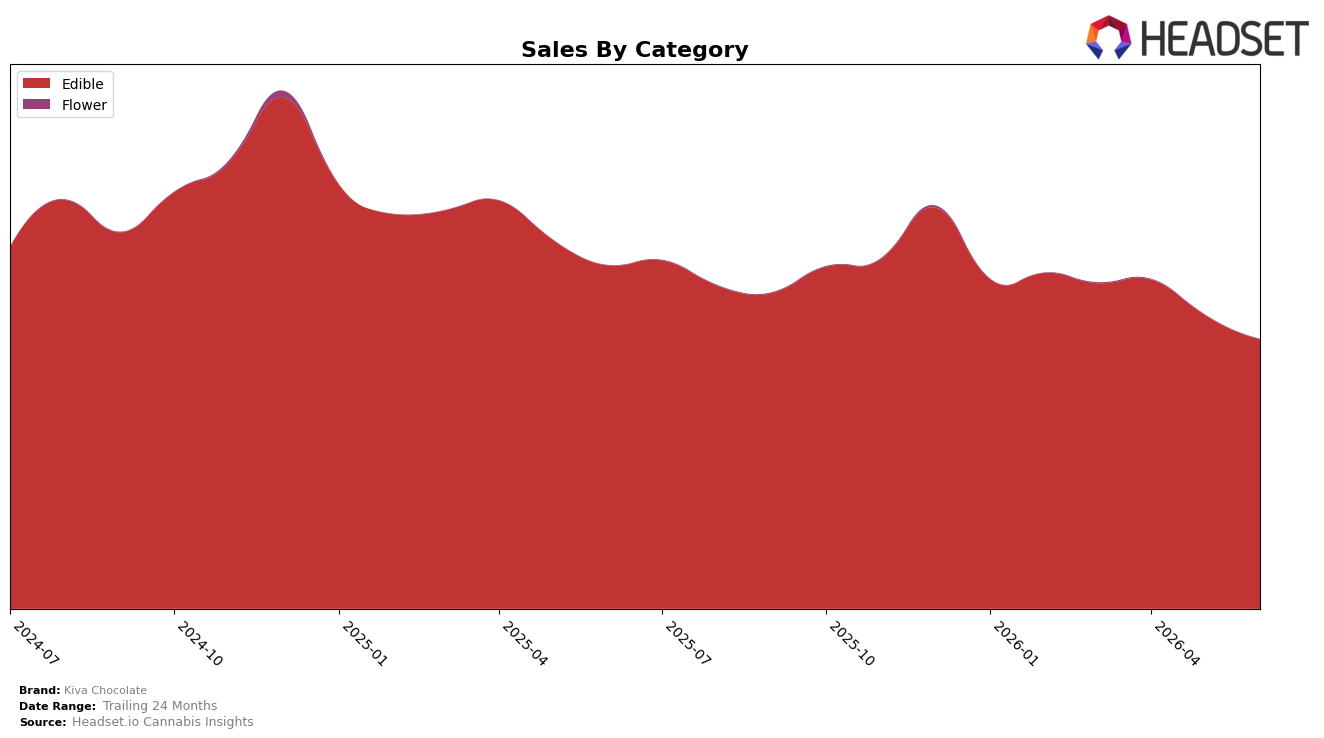
In June 2026, Kiva Chocolate remained overwhelmingly concentrated in Edible, with a 99.98% category share while Flower held 0.02%; within Edible, year-over-year sales declined 21.52% and month-over-month fell 8.28%. Average price in Edible ticked up 1.45% year over year to $18.71, while the marginal Flower line dropped 80.38% month over month and contributed less than 0.02% share; together, these shifts align with a brand-level year-over-year sales change of -21.50% and a 24-month change of -25.76%. The pattern implies that Kiva Chocolate is absorbing volume pressure primarily within Edible rather than via mix erosion, with modest price inflation unable to offset unit softness on both the yearly and monthly horizons.
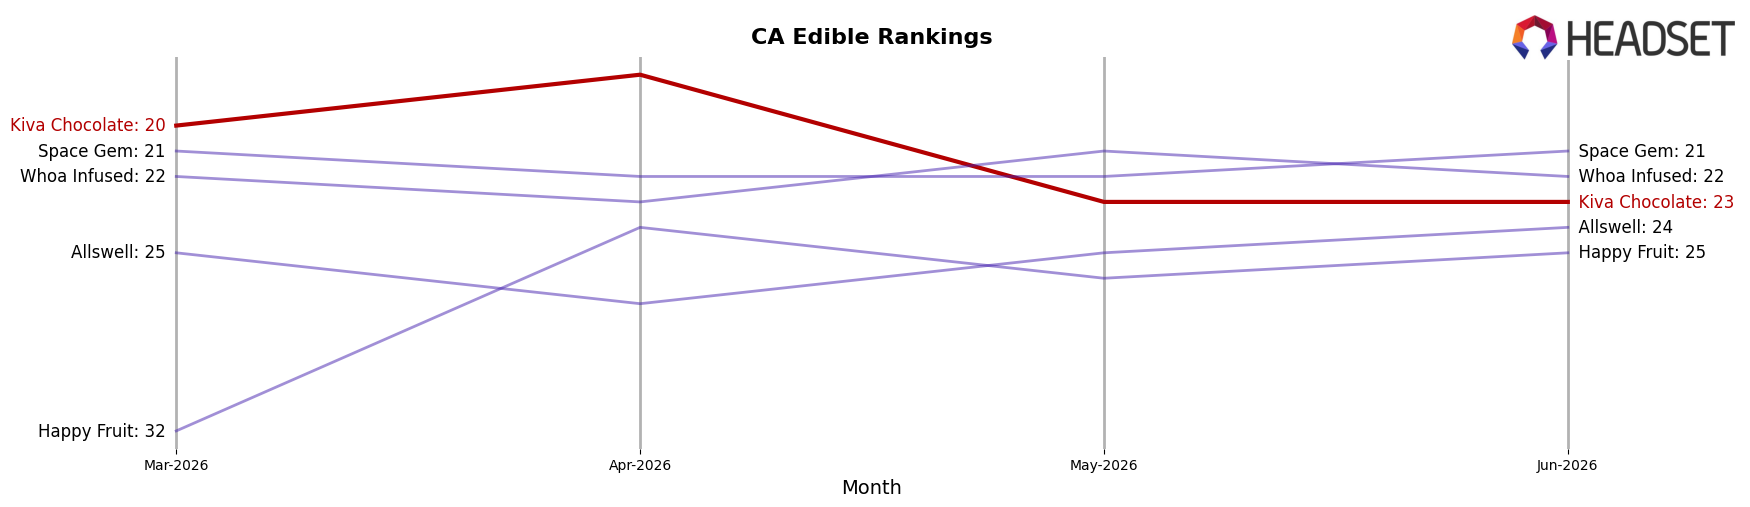
Within California Edible, Kiva Chocolate held rank 23 while Edible comprised 99.98% of sales and posted an 8.28% month-over-month decline, indicating positioning tied to category-wide demand swings rather than diversification buffer. With Edible’s year-over-year drop of 21.52% coinciding with a 1.45% price increase and Flower’s 80.38% month-over-month contraction at a 0.02% share, the mix suggests limited elasticity headroom and negligible cross-category hedge. This implies Kiva Chocolate’s competitive stance in Edible hinges on stabilizing unit velocity at current price tiers in June 2026 and reinforcing placement to defend rank 23 against further month-over-month slippage.
Competitive Landscape
Kiva Chocolate sits at rank #23 in CA Edible for June 2026, down 6 positions year over year from #17 and 3 positions since March 2026 from #20, despite a prior peak of #15 in December 2025; meanwhile, Wyld held #1 both year over year and in June 2026 even as its sales dipped 1.9%, and Camino stayed at #2 while growing sales 12.9%, indicating that Kiva Chocolate’s slide amid stable top-tier positions points to share consolidation at the top that is pressuring mid-tier ranks and implies Kiva Chocolate is ceding relative placement to brands maintaining or improving efficiency.
Notable Products
Blackberry Dark Chocolate Bar (200mg) posted the steepest decline in June 2026 at -43.3% MoM while sliding to rank 8, and Dark Sea Salt Chocolate Bar 20-Pack (100mg) also retreated -32.8% MoM yet held rank 1. In contrast, Milk Chocolate Bar 20-Pack (100mg) rose +10.2% MoM and secured rank 2, creating a widening gap between the top two SKUs and the mid-pack where THC/CBN 5:2 Midnight Mint Dark Chocolate Bar 20-Pack (100mg THC, 40mg CBN) dipped -6.9% MoM at rank 3. With nine of the top ten being Edible chocolate bars and only one gummy in the top ten, the concentration signals a portfolio leaning on classic bar formats even as higher-dose variants at ranks 5 through 9 post double‑digit MoM declines, implying Kiva Chocolate may need to rebalance toward fewer 200mg extensions and steadier 100mg leaders to sustain velocity.
Top Selling Cannabis Brands
Data for this report comes from real-time sales reporting by participating cannabis retailers via their point-of-sale systems, which are linked up with Headset’s business intelligence software. Headset’s data is very reliable, as it comes digitally direct from our partner retailers. However, the potential does exist for misreporting in the instance of duplicates, incorrectly classified products, inaccurate entry of products into point-of-sale systems, or even simple human error at the point of purchase. Thus, there is a slight margin of error to consider. Brands listed on this page are ranked in the top twenty within the market and product category by total retail sales volume.

