.svg)


Where to Buy
Dro is stocked at 50 licensed dispensaries across Colorado, with the deepest coverage in Denver, Boulder, Colorado Springs, Aspen, and Aurora. Search by ZIP code or city below to find the closest one, or filter by product type if you are after a specific format.
Market Insights Snapshot
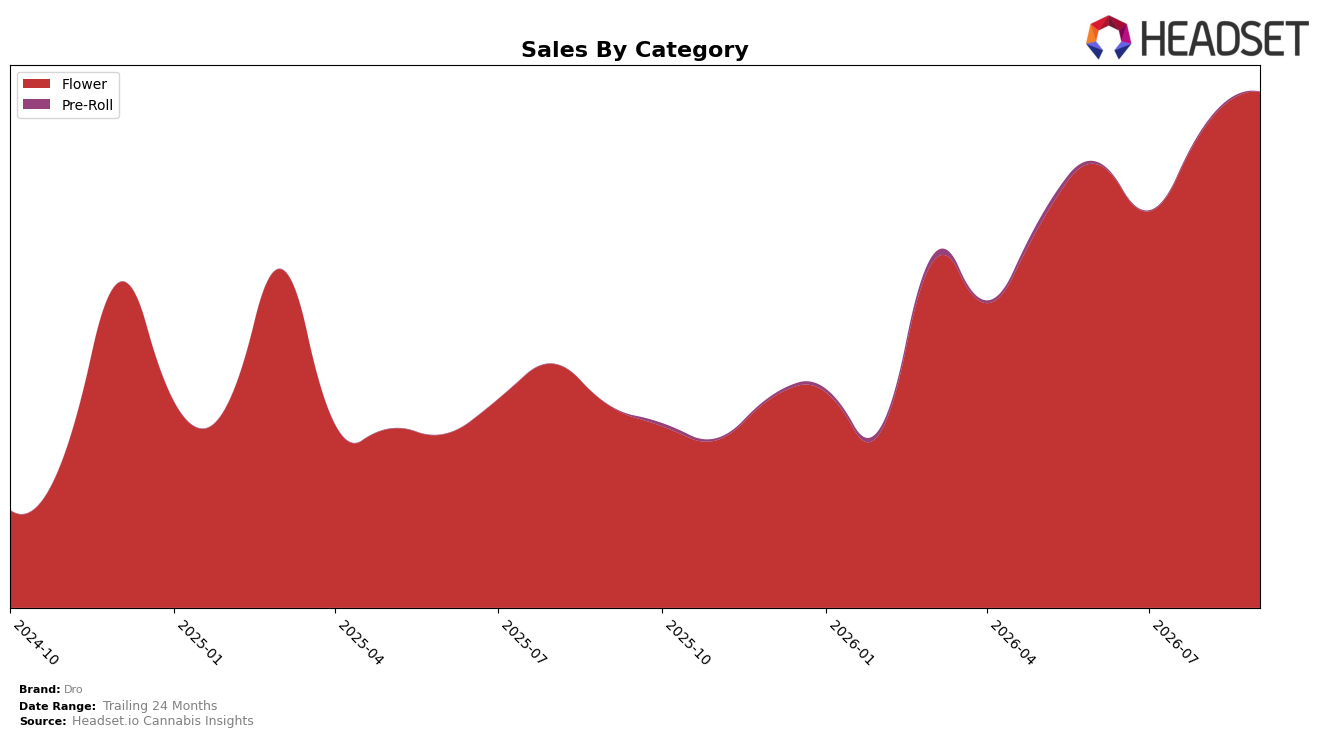
In September 2026, Dro concentrated entirely in Flower with a 100.0% category share, pairing 154.59% year-over-year sales growth with 7.43% month-over-month growth. Average price rose 16.55% YoY to $42.97 while retaining a full-category focus, and the brand held rank 6 in Flower within Colorado. The combination of triple-digit YoY expansion and single-digit MoM momentum in a single-category footprint implies that revenue gains are tied to depth within Flower rather than diversification, with pricing power contributing a secondary lift.
Given a 100.0% mix in Flower alongside a rank of 6 in Colorado Flower, Dro’s positioning leans on scale and pricing within its core rather than adjacency expansion, as indicated by the 16.55% YoY price increase against 7.43% MoM sales growth. The 154.59% YoY sales rise combined with a 487.81% 24-month uplift suggests headroom remains within Flower before category spread becomes necessary, but maintaining the September 2026 rank will depend on balancing further volume gains with price discipline as the single-category exposure amplifies volatility risk.
Competitive Landscape
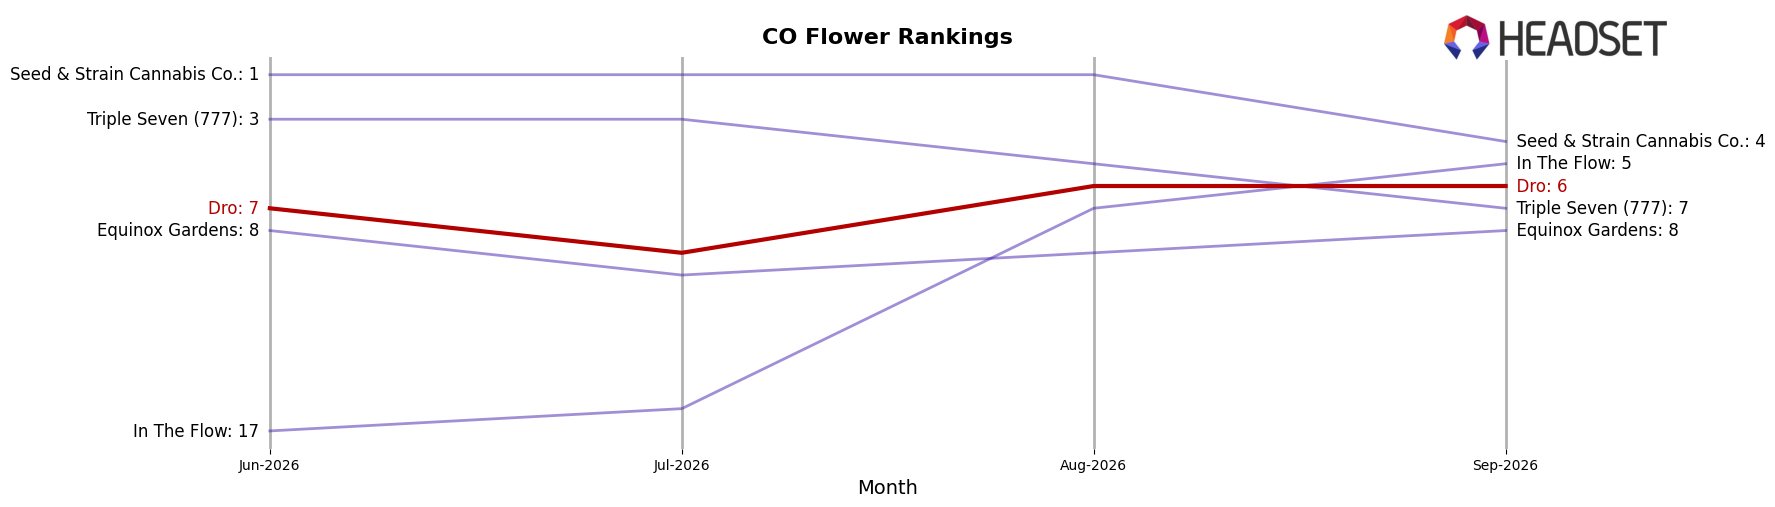
Dro sits at rank #6 in CO Flower in September 2026, improving 11 positions from #17 year over year, and edging up one spot from #7 in June 2026; this coincides with its peak rank of #6 in September 2026 while Green Label Cannabis held #1 both this year and last (#1 to #1) and In The Flow advanced from #12 to #5 with 113.5% YoY sales growth. Against the mid-pack, Seed & Strain Cannabis Co. slipped from #2 to #4 on a -33.5% YoY sales decline while Good Chemistry Nurseries climbed from #3 to #2 with 45.5% YoY growth, indicating Dro’s 11-rank YoY rise positions it as a late-advancing contender that benefits from volatility above it but must outpace faster climbers to convert a top-6 foothold into durable top-5 presence.
Notable Products
Blue Nerds (7g) set the tone in September 2026 with a -19.5% month-over-month drop and a slide to rank 4, while Honey Banana (7g) fell -44.8% yet still held rank 9, indicating a sharper pullback concentrated in select legacy SKUs. In contrast, PurpZ (7g) climbed 26.7% MoM to rank 2 and Blue Sherb Runtz (7g) gained 38.3% MoM at rank 6, as Flower occupied all top-10 slots and Mango Monster (7g) added 38.1% MoM to reach rank 8, concentrating momentum in newer flavor profiles. Lazer Jet (7g) remained rank 1 with $90,494 and Lemonade Bacio (7g) added 12.6% MoM at rank 3, while four of the top five ranks were Flower, pointing to a product mix skew where rising, fruit-forward lines offset steep declines in legacy strains. The pattern implies Dro is consolidating leadership around fast-cycling Flower innovations while quietly rotating out underperforming heritage SKUs to sustain rank density at the top of the chart.
Top Selling Cannabis Brands






Data for this report comes from real-time sales reporting by participating cannabis retailers via their point-of-sale systems, which are linked up with Headset’s business intelligence software. Headset’s data is very reliable, as it comes digitally direct from our partner retailers. However, the potential does exist for misreporting in the instance of duplicates, incorrectly classified products, inaccurate entry of products into point-of-sale systems, or even simple human error at the point of purchase. Thus, there is a slight margin of error to consider. Brands listed on this page are ranked in the top twenty within the market and product category by total retail sales volume.

