Jun-2026
Sales
Trend
6-Month
Product Count
SKUs
Avg Price
YoY Sales Change
YoY Price Change
Market Insights Snapshot
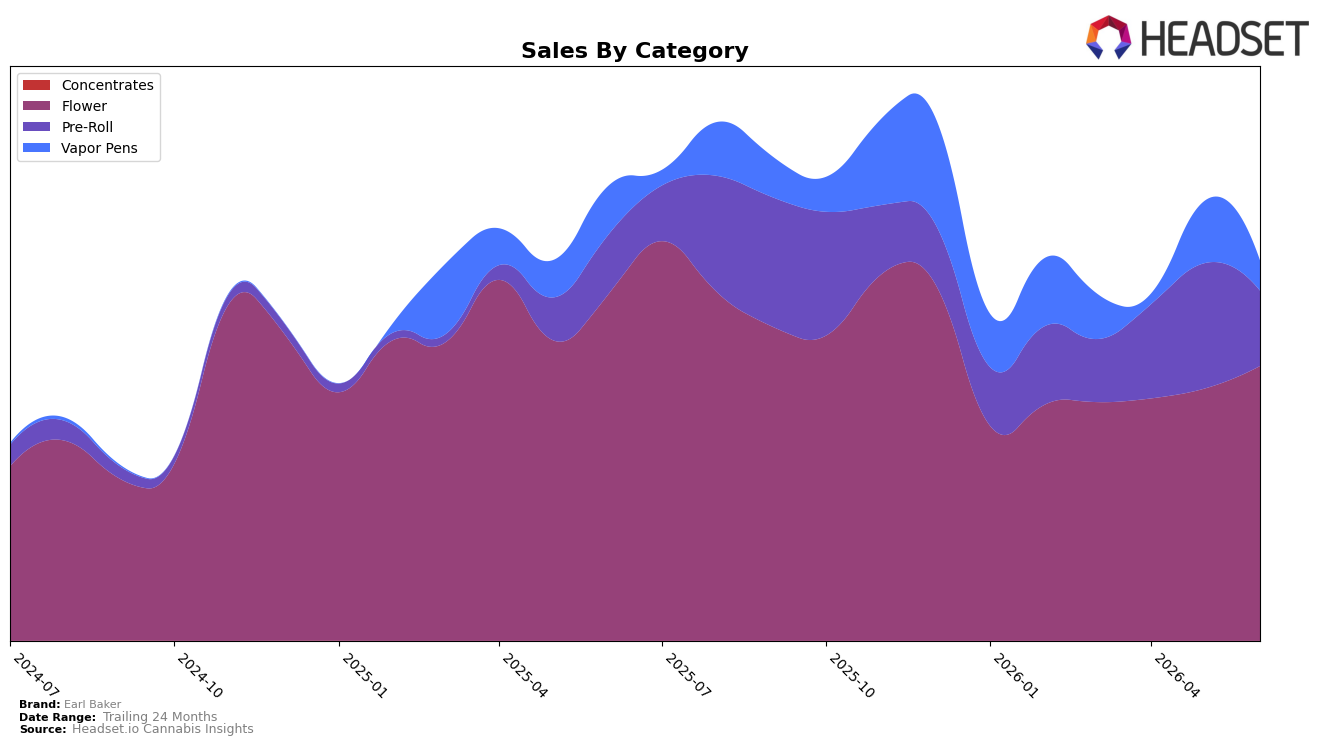
Earl Baker concentrated 72.34% of June 2026 sales in Flower, where year-over-year sales fell 20.69% even as month-over-month grew 8.94%, while Pre-Roll held 19.77% share with a 26.70% YoY gain but a 40.00% MoM drop, and Vapor Pens at 7.89% declined 38.40% YoY and 51.72% MoM. Average price dropped 16.81% YoY to $22.54 alongside a 16.40% YoY sales decline, and Flower’s average price at $26.47 contrasts with Vapor Pens at $57.58, indicating mix pressure. In Connecticut Flower, Earl Baker ranked 14, and with Pre-Roll momentum YoY but sharp MoM retrenchment, the pattern implies the brand is leaning on Flower for volume while Pre-Roll volatility and Vapor Pen contraction cap upside.
With Flower up 8.94% MoM yet down 20.69% YoY, and Pre-Roll up 26.70% YoY but down 40.00% MoM, Earl Baker’s positioning skews toward defending a large base rather than expanding premium adjacencies; Vapor Pens’ 38.40% YoY and 51.72% MoM declines limit cross-category laddering. Holding 72.34% share in Flower while sitting at rank 14 in Connecticut suggests a mid-pack stance where incremental gains likely come from stabilizing Pre-Roll volatility and selectively rebuilding Vapor Pens rather than chasing further price cuts amid a 16.81% YoY average price decline; the implication is to trade volatility in smaller categories for steadier Flower-led share retention.
Competitive Landscape
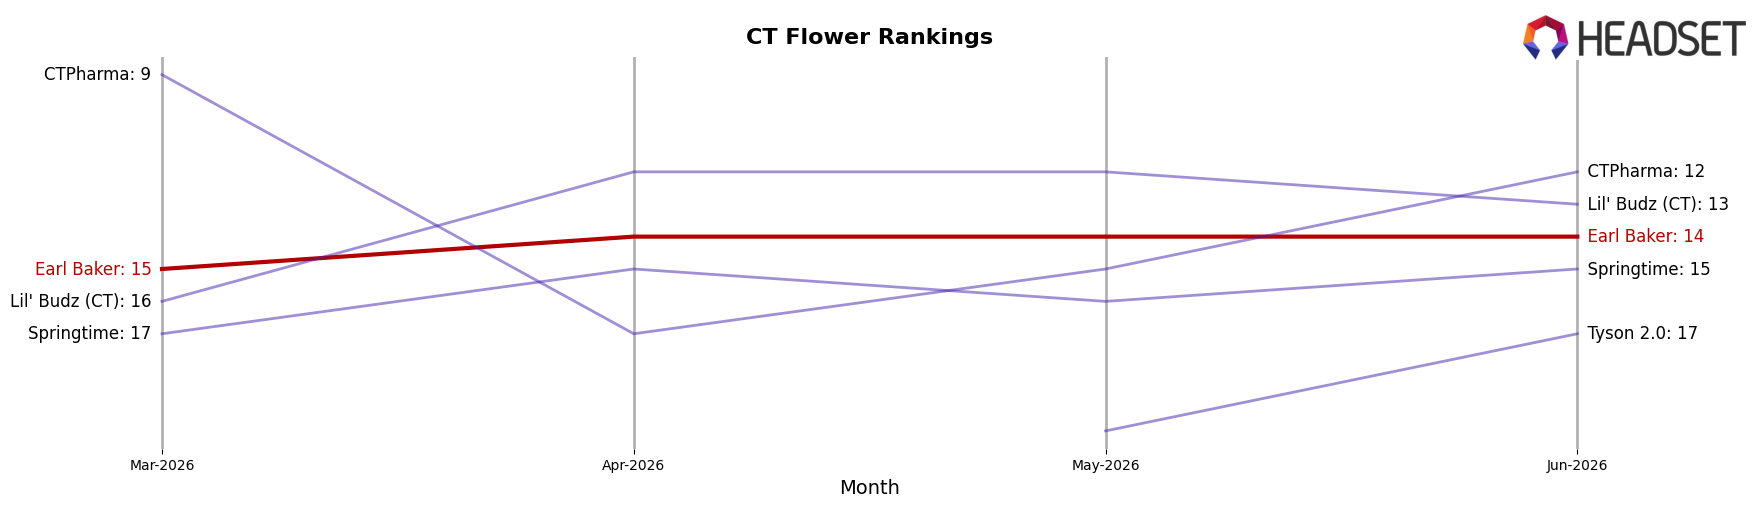
Earl Baker sits at rank #14 in June 2026 in CT Flower, down 2 positions year over year from #12, while improving 1 spot versus March 2026’s #15; against this backdrop, Theraplant moved up from #5 to #1 with 69.2% YoY sales growth and Find. advanced from #9 to #4 with an 86.9% YoY lift, indicating Earl Baker’s relative share and visibility are compressing as faster climbers overtake it. The brand is 7 ranks below its November 2024 peak of #7 and 12 positions behind the current leader, suggesting that without a reversal of the -2 rank YoY slide and a more than 1-rank recovery from the last three months, the trajectory points to continued mid-tier placement rather than re-entry into the top 10.
Notable Products
Periwinkle Pez Pre-Roll (1g) posted the largest move in June 2026 with +93.0% month over month, entering the top five at rank 5 while Trophy Diesel (1g) climbed to rank 2 on +54.9% MoM. In contrast, Strawberry Fizz (Bulk) slid to rank 10 on -73.9% MoM, marking a sharp retreat that offsets the Flower momentum at ranks 1 and 2. Four of the top ten are Pre-Roll SKUs, and Flower still occupies five of the top ten including the top two positions, indicating a split demand curve where Pre-Roll velocity is accelerating even as one legacy Bulk Flower SKU compresses. This mix points to Earl Baker leaning into faster-turn formats for share capture while selectively culling underperforming Bulk Flower despite one Flower unit generating $23,333.
Top Selling Cannabis Brands
Data for this report comes from real-time sales reporting by participating cannabis retailers via their point-of-sale systems, which are linked up with Headset’s business intelligence software. Headset’s data is very reliable, as it comes digitally direct from our partner retailers. However, the potential does exist for misreporting in the instance of duplicates, incorrectly classified products, inaccurate entry of products into point-of-sale systems, or even simple human error at the point of purchase. Thus, there is a slight margin of error to consider. Brands listed on this page are ranked in the top twenty within the market and product category by total retail sales volume.

