Jun-2026
Sales
Trend
6-Month
Product Count
SKUs
Avg Price
YoY Sales Change
YoY Price Change
Market Insights Snapshot
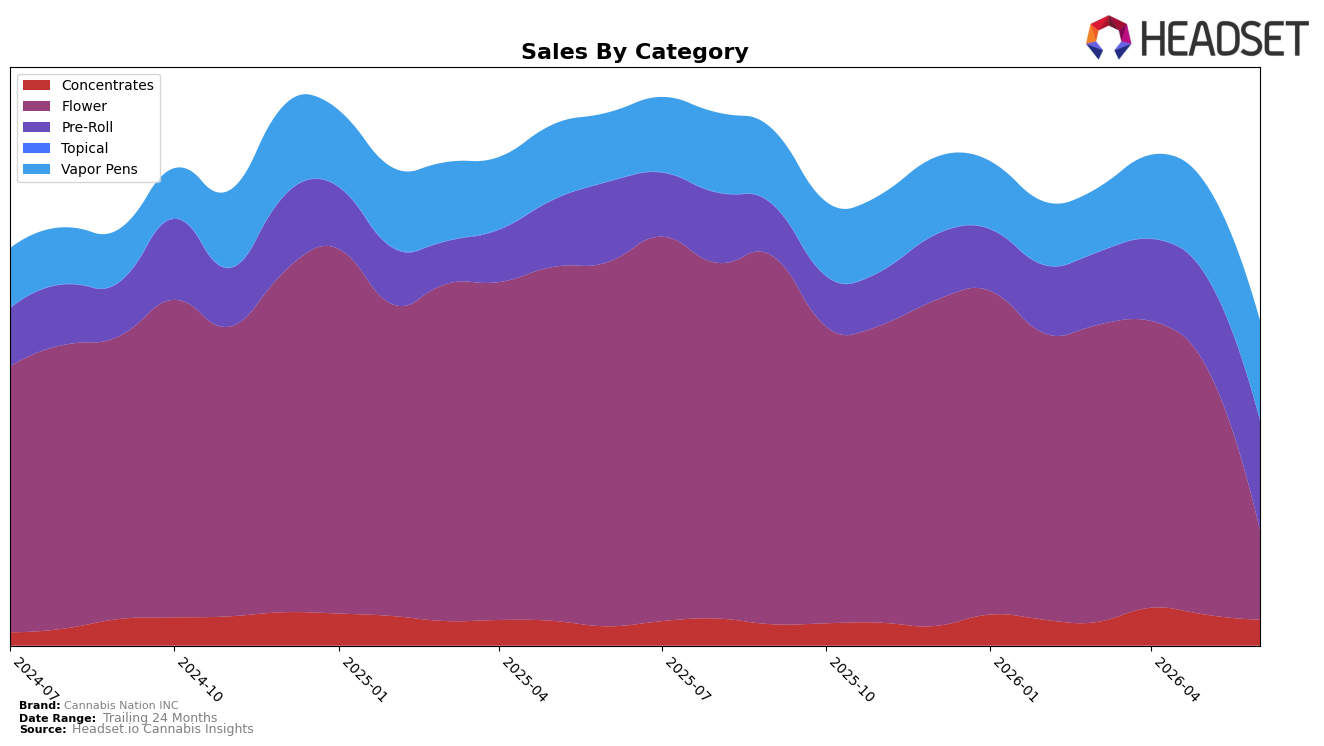
In June 2026, Cannabis Nation INC concentrated into inhalables, with Pre-Roll at 33.85% share and Vapor Pens at 30.64%, while Flower slipped to 27.57% and Concentrates held 7.93%. Pre-Roll grew 37.13% year over year and 21.83% month over month, and Vapor Pens rose 44.52% YoY and 9.31% MoM, yet Flower contracted 75.50% YoY and 64.37% MoM; Concentrates added 34.62% YoY but fell 16.82% MoM. The brand’s overall sales declined 39.15% YoY alongside a 37.94% YoY drop in average price to $12.20, while the top state remained Oregon and the leading category stayed Pre-Roll, where the brand ranked 26th. The pattern implies a deliberate pivot away from Flower toward value-leaning Pre-Roll and higher-ticket Vapor Pens, with pricing compression funding volume but not offsetting the aggregate YoY decline.
The shift toward Pre-Roll and Vapor Pens reallocates mix toward faster-growing, more defensible shelf space, evidenced by dual-digit MoM gains of 21.83% and 9.31% alongside double-digit YoY lifts of 37.13% and 44.52%, while the 75.50% YoY and 64.37% MoM plunge in Flower reduces exposure to the most volatile segment. Holding the 26th rank in Oregon Pre-Rolls while cutting average prices 37.94% YoY indicates a price-led route to basket entry that can ladder into Vapor Pens at a $30.23 average, suggesting a barbell strategy where Pre-Roll scale feeds trial and Vapor Pens monetizes; the implication is that maintaining or improving rank will depend on sustaining Pre-Roll price-accessible offerings while defending Vapor Pen margin as mix tilts further away from Flower.
Competitive Landscape
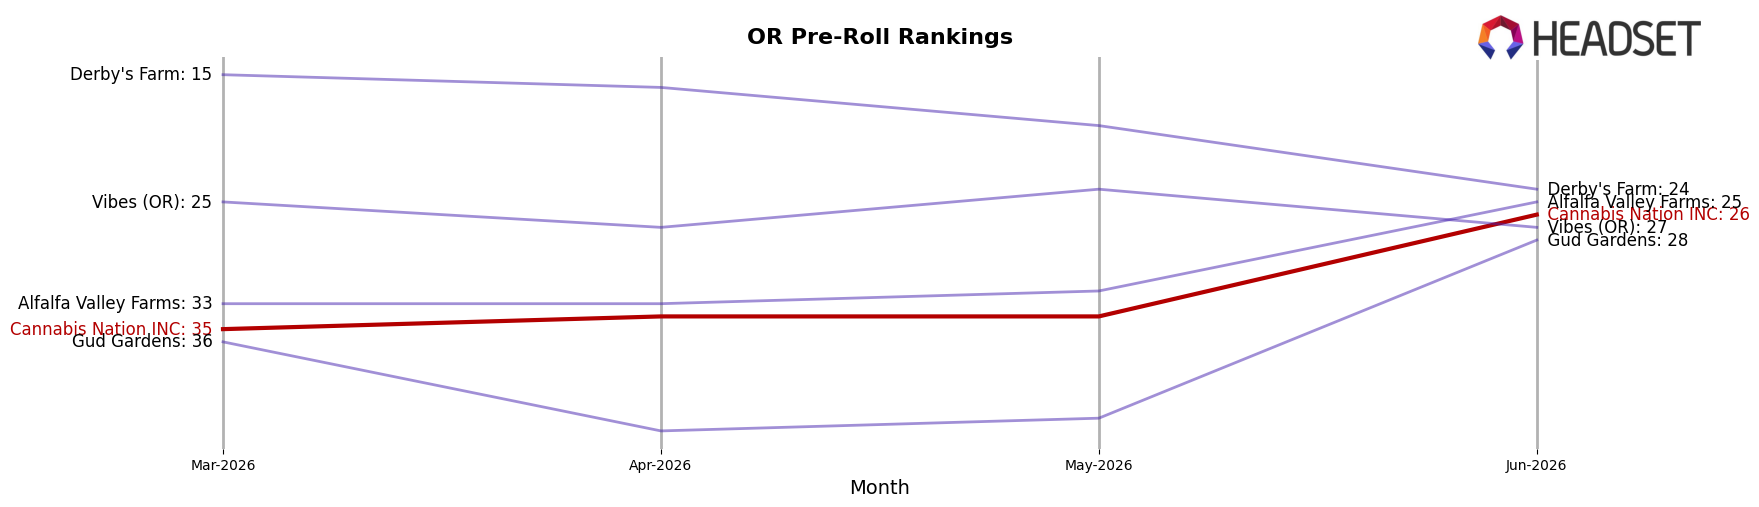
Cannabis Nation INC sits at rank 26 in OR Pre-Roll in June 2026, a 9-position climb from rank 35 year over year, and a 9-position rise versus March 2026, marking its peak rank to date at 26 with June 2026 as the peak month. In contrast, STiCKS moved from rank 2 to rank 1 while growing sales 164.98% year over year, and Hellavated slipped from rank 1 to rank 3 despite a 15.90% sales increase, indicating the top tier is fluid while Cannabis Nation INC is closing a multi-rank gap from the mid-pack. The juxtaposition of Cannabis Nation INC’s 9-rank YoY improvement and peers like Portland Heights dropping from rank 3 to rank 4 with a 26.34% sales decline signals that Cannabis Nation INC’s trajectory is upward against softening or shifting competitors, implying a window to convert recent rank momentum into sustained share if the brand can translate mid-20s placement into repeat visibility.
Notable Products
Blue Storm Pre-Roll 2-Pack (1g) posted the steepest movement in June 2026 with a -17.4% month-over-month change while holding rank 7, contrasting with Ghetto Bird Pre-Roll 2-Pack (1g) at rank 5 with a +50.3% gain. Craven OG Pre-Roll 2-Pack (1g) advanced to rank 2 on +40.5% MoM, while Maui Kush Pre-Roll 2-Pack (1g) maintained rank 1 alongside a category concentration where all top ten items are Pre-Roll SKUs. The mix shows momentum pooling in a few value-driven two-pack formats as mid-pack volatility widens, implying Cannabis Nation INC is consolidating around pre-roll depth rather than broadening into new categories.
Top Selling Cannabis Brands
Data for this report comes from real-time sales reporting by participating cannabis retailers via their point-of-sale systems, which are linked up with Headset’s business intelligence software. Headset’s data is very reliable, as it comes digitally direct from our partner retailers. However, the potential does exist for misreporting in the instance of duplicates, incorrectly classified products, inaccurate entry of products into point-of-sale systems, or even simple human error at the point of purchase. Thus, there is a slight margin of error to consider. Brands listed on this page are ranked in the top twenty within the market and product category by total retail sales volume.

