Jun-2026
Sales
Trend
6-Month
Product Count
SKUs
Avg Price
YoY Sales Change
YoY Price Change
Market Insights Snapshot
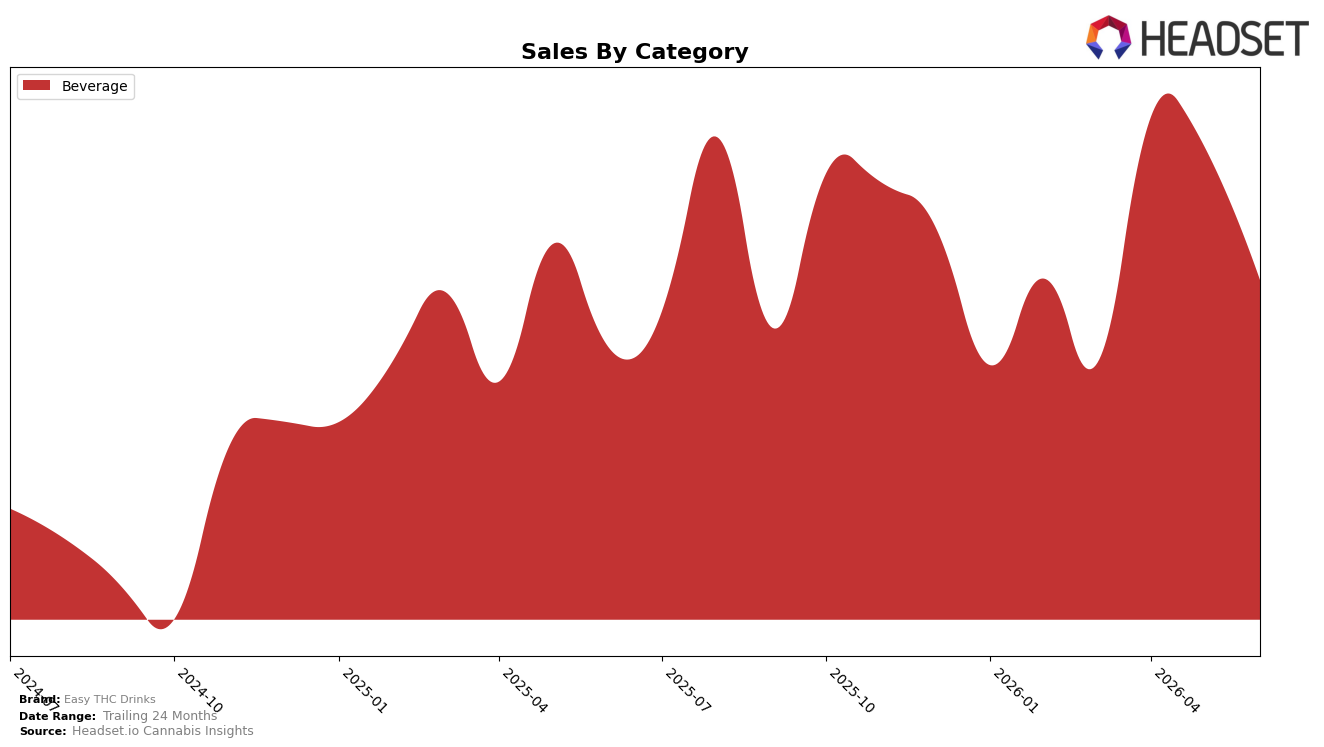
In June 2026, Easy THC Drinks operated as a single-category brand with Beverage at 100.0% of sales, posting a year-over-year gain of 12.9% alongside a month-over-month decline of 18.5%. Average price held nearly flat year over year at up 3.0% while the category share remained at 100.0%, and the brand sat at rank 13 in Beverage within Massachusetts. The pattern implies concentration risk: full reliance on Beverage amplifies volatility, with June’s MoM dip offset by an annual uptick that suggests the base is growing but near-term velocity softened.
Positioning-wise, a 100.0% Beverage mix coupled with a 12.9% YoY lift and an 18.5% MoM pullback indicates a need to stabilize repeat purchasing within the core rather than diversify immediately. Holding rank 13 in Massachusetts while average price is up 3.0% suggests price tolerance exists but may be pressuring short-cycle volumes; maintaining price while targeting pack-size or flavor rotations could convert the YoY momentum into steadier month-to-month sell-through.
Competitive Landscape
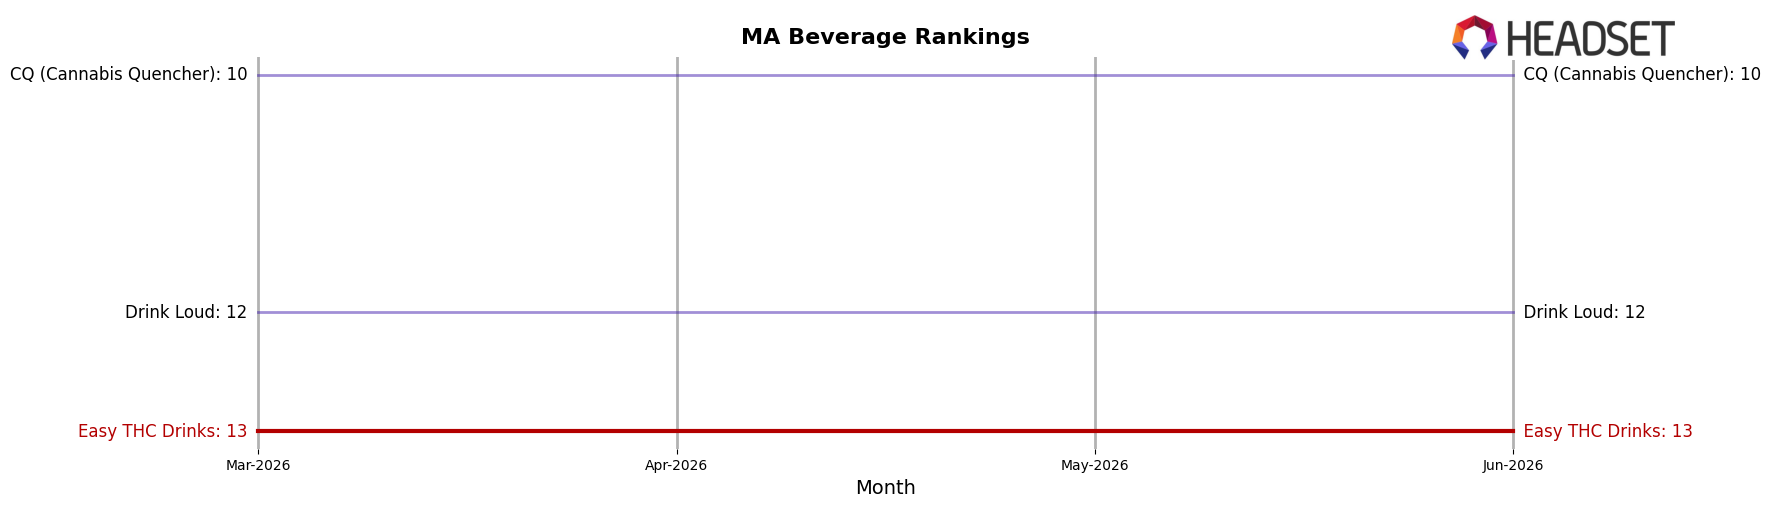
Easy THC Drinks sits at rank #13 in MA Beverage in June 2026, improving 1 spot year over year from #14 and holding flat versus March 2026 at #13; its best position was #12 in February 2026, a 1-rank lift from today. Competitors are stretching the gap at the top: Levia held #1 year over year while growing sales 35.5%, and Hi5 Seltzer stayed at #2 with 31.9% YoY sales growth, whereas Buzzy remained at #3 despite a 15.9% YoY sales decline; meanwhile Pine + Star climbed from #5 to #4 and Squier's Elixirs moved from #6 to #5, each advancing 1 rank. The pattern implies Easy THC Drinks is stuck in a narrow band—up 1 rank YoY but down 1 from its February 2026 peak—while faster-moving rivals either compound gains at the top or backfill mid-tier slots, raising the bar for upward mobility.
Notable Products
Lemon Bubbly Water (5mg THC, 12oz) posted the steepest decline at -36.9% MoM while dropping to rank 2, and Grapefruit Bubbly Water (5mg THC, 12oz) fell -19.2% MoM at rank 3. In contrast, Lime Bubbly Water (5mg THC, 12oz) inched up +3.9% MoM to hold rank 1 with $8,132, and all three top-3 positions remain within the Beverage category, concentrating the lineup in a single format. The pattern implies Easy THC Drinks is over-reliant on citrus seltzers where small gains in the lead SKU cannot offset sharp declines in the flanking SKUs, signaling a need to diversify flavor appeal within Beverage.
Top Selling Cannabis Brands
Data for this report comes from real-time sales reporting by participating cannabis retailers via their point-of-sale systems, which are linked up with Headset’s business intelligence software. Headset’s data is very reliable, as it comes digitally direct from our partner retailers. However, the potential does exist for misreporting in the instance of duplicates, incorrectly classified products, inaccurate entry of products into point-of-sale systems, or even simple human error at the point of purchase. Thus, there is a slight margin of error to consider. Brands listed on this page are ranked in the top twenty within the market and product category by total retail sales volume.

