.svg)

Sep-2026
Sales
Trend
6-Month
Product Count
SKUs
Avg Price
YoY Sales Change
YoY Price Change


Where to Buy
El Blunto is stocked at 233 licensed dispensaries across California, Missouri, and 3 other states, 198 of them in California, with the deepest coverage in Los Angeles, San Diego, San Francisco, Sacramento, and San Jose. Search by ZIP code or city below to find the closest one.
Market Insights Snapshot
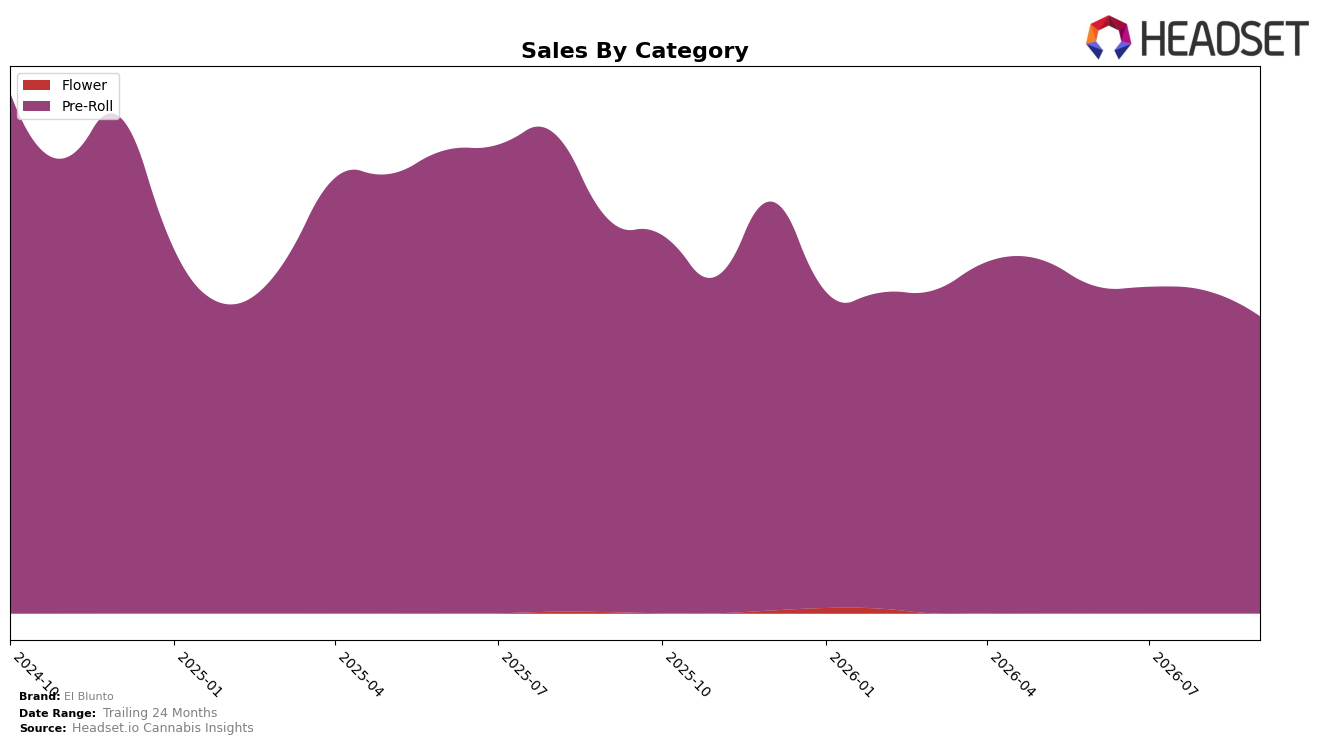
El Blunto concentrated entirely in Pre-Roll with a 100.0% category share in September 2026, while Pre-Roll sales declined 24.43% year over year and 8.03% month over month. Average price fell 19.74% YoY to $20.31, aligning with the brand’s total sales YoY change of -24.66% and its 24-month change of -42.88%. With Pre-Roll as the sole contributor, the pattern implies limited shock absorption across categories; a single-category footprint magnifies the impact of category-level price compression and rank movement, as reflected in a rank of 49 in California Pre-Roll.
The 100.0% Pre-Roll mix paired with a 19.74% YoY price decline and an 8.03% MoM sales dip signals a positioning driven more by price-led throughput than by mix diversification or premium upsell. Given a top state of ON and a rank of 49 in California Pre-Roll, the brand’s footprint likely leans on regional pockets where price elasticity is higher, but the YoY sales drop of 24.43% within the sole category suggests the current price band is not offsetting volume softness. The implication is that maintaining a single-category strategy at this price level risks further share erosion when category pricing compresses, whereas targeted pack architecture or format differentiation within Pre-Roll could redistribute volume without requiring cross-category expansion.
Competitive Landscape
El Blunto sits at rank #60 in ON Pre-Roll for September 2026, down 11 positions from #49 year over year, while holding flat versus June 2026 at #60. The brand’s peak at #33 in December 2024 marks a 27-rank slide from its historical high, whereas category leaders moved in opposite directions: Back Forty / Back 40 Cannabis climbed from #2 to #1 alongside a 46.6% year-over-year sales gain, and General Admission slipped from #1 to #2 amid a 38.2% year-over-year decline. With Thumbs Up Brand rising from #8 to #3 on 62.1% growth and Spinach jumping from #17 to #4 on 141.2% growth, El Blunto’s 11-place YoY drop and three-month stasis at #60 imply share is consolidating toward faster movers, and recovery will require either category entry-point pricing or format mix shifts to re-engage the ranks.

Notable Products
Cullinan Diamond Infused Blunt (2g) posted the steepest move in September 2026 with a -30.1% month-over-month drop while still holding rank 2, signaling elasticity risks at the premium 2g tier. In contrast, Cullinan Diamond Infused Pre-Roll (1g) rose 18.0% MoM to rank 1 and Especial Silver - Lila Infused Blunt (1.5g) advanced 26.4% MoM at rank 4, creating a split where smaller formats gain share as larger-format diamond SKUs retrench. With Pink Legacy Diamond Infused Blunt (2g) down 19.6% MoM at rank 8 and four of the top ten belonging to the Especial Silver family, mix is tilting toward mid-size 1–1.5g value plays rather than 2g diamond-heavy blunts, implying portfolio emphasis should shift toward accessible infused formats over bulk-diamond offerings.
Top Selling Cannabis Brands






Data for this report comes from real-time sales reporting by participating cannabis retailers via their point-of-sale systems, which are linked up with Headset’s business intelligence software. Headset’s data is very reliable, as it comes digitally direct from our partner retailers. However, the potential does exist for misreporting in the instance of duplicates, incorrectly classified products, inaccurate entry of products into point-of-sale systems, or even simple human error at the point of purchase. Thus, there is a slight margin of error to consider. Brands listed on this page are ranked in the top twenty within the market and product category by total retail sales volume.

