.svg)
Sep-2026
Sales
Trend
6-Month
Product Count
SKUs
Avg Price
YoY Sales Change
YoY Price Change


Market Insights Snapshot
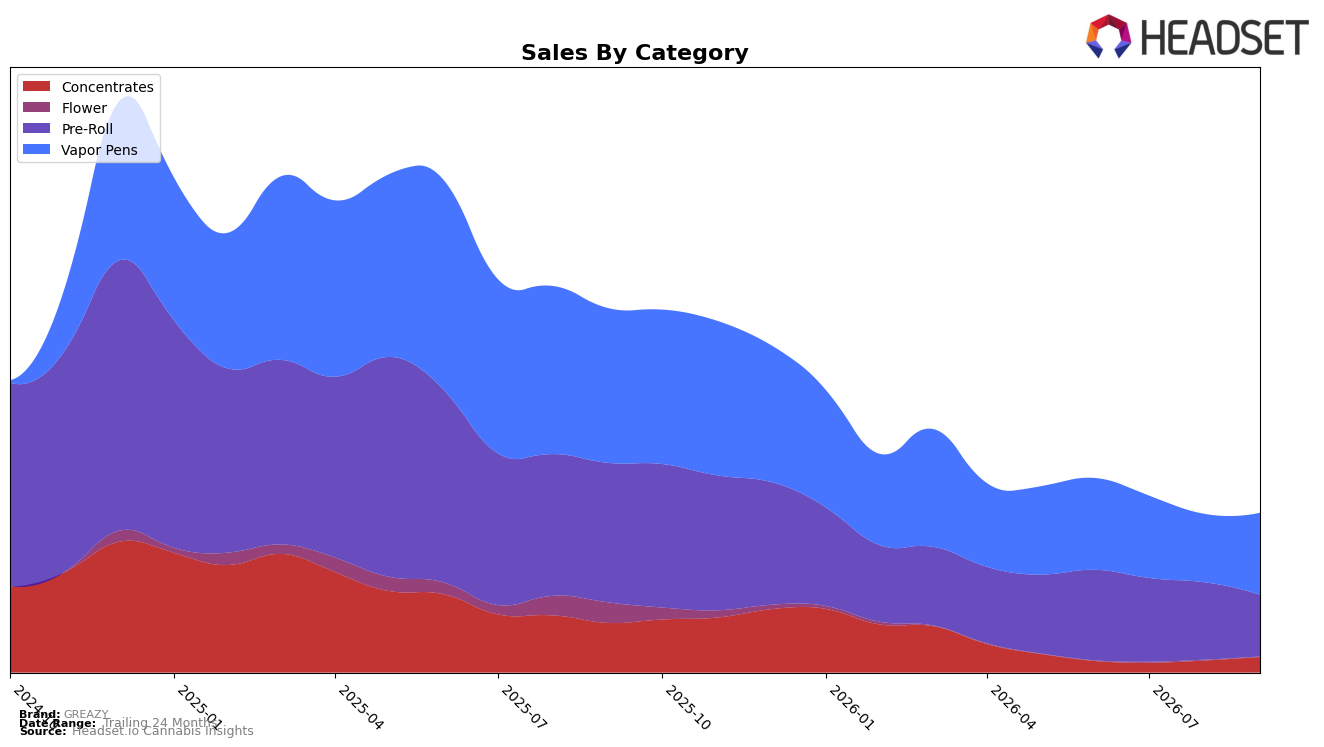
GREAZY’s category mix in September 2026 is concentrated in Vapor Pens at 51.44% share with a month-over-month gain of 19.84% despite a year-over-year decline of 47.13%, while Pre-Roll holds 38.74% share with a month-over-month drop of 20.26% and a year-over-year decline of 55.81%. Concentrates account for 9.67% share with a 29.42% month-over-month increase but a 68.97% year-over-year decline, and Flower is marginal at 0.15% share with a 53.85% month-over-month decline and a 98.80% year-over-year decline. With overall brand sales down 56.31% year over year and average price up 0.18%, the mix signals a pivot toward Vapor Pens and a rebound in Concentrates on a monthly basis, implying near-term reliance on inhalables where short-run velocity is improving even as annual comps remain negative.
These shifts position GREAZY to lean into Vapor Pens as a primary traffic and revenue engine, given its 51.44% share and a 19.84% month-over-month lift, while the 20.26% month-over-month pullback in Pre-Roll and the 98.80% year-over-year collapse in Flower suggest deprioritization of combustion formats. The 29.42% month-over-month increase in Concentrates alongside a 9.67% mix share indicates a secondary platform that can absorb some lost Pre-Roll volume, and the 0.18% average price uptick amid a 56.31% year-over-year sales drop implies elasticity constraints that favor focusing on assortment depth over price moves. In Ontario Vapor Pens, a rank of 43 coupled with a 47.13% year-over-year decline but a 19.84% month-over-month improvement points to a recoverable position if GREAZY concentrates distribution and promo cadence where month-level momentum is measurable.
Competitive Landscape
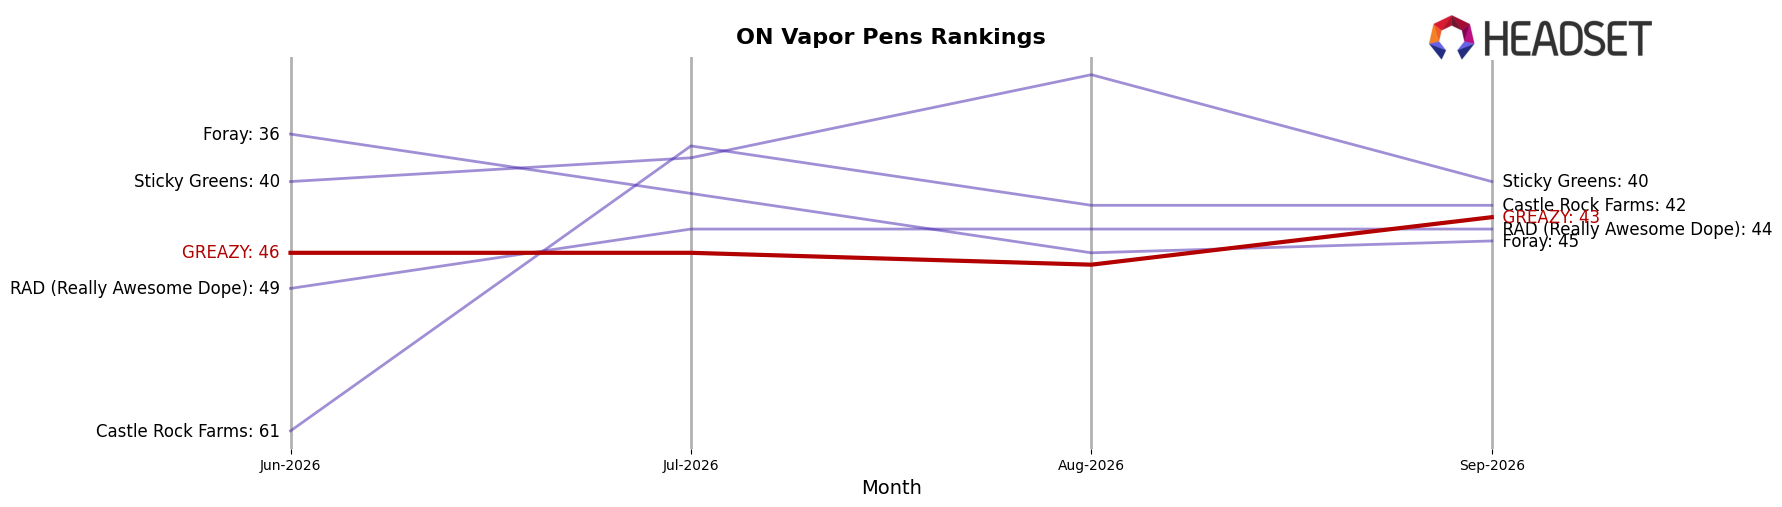
GREAZY sits at rank #43 in ON Vapor Pens in September 2026, down 11 positions year over year from #32, but up 3 ranks from #46 in June 2026; this contrasts with Spinach climbing from #4 to #1 and General Admission slipping from #3 to #4 alongside a -12.0% YoY sales change. Despite a historical peak at #24 in March 2025 and competitors like Kolab rising from #14 to #5 with +93.0% YoY sales growth, GREAZY’s current #43 suggests share is consolidating higher in the table while GREAZY yields rank to faster movers, implying the brand must reverse the -11 rank YoY slide to avoid further marginalization in the long tail.
Notable Products
Chemdawg Diamond Infused Pre-Roll 3-Pack (1.5g) posted the steepest movement in September 2026 with a -59.1% month-over-month drop to $9,556 and slid to rank 10, while Afghan Black Hash (2g) also contracted by -17.6% at rank 6; in contrast, the category leader Grape God Liquid Diamonds Cartridge (1g) rose +20.0% at rank 1. With two Vapor Pens in the top 10 including Grape God at rank 1 and Ginger Fizz Live Liquid Diamonds Disposable (1g) at rank 7, and four of the top ten as Pre-Rolls spanning ranks 2–5 and 10 where MAC10 fell -35.9% at rank 2 but Orange Kush CK advanced +17.3% at rank 3, the mix tilts away from Infused Pre-Rolls and toward established cartridges. This pattern implies GREAZY’s near-term growth is consolidating around a single flagship Vapor Pen while volatility in Infused Pre-Rolls pressures breadth of the portfolio.
Top Selling Cannabis Brands






Data for this report comes from real-time sales reporting by participating cannabis retailers via their point-of-sale systems, which are linked up with Headset’s business intelligence software. Headset’s data is very reliable, as it comes digitally direct from our partner retailers. However, the potential does exist for misreporting in the instance of duplicates, incorrectly classified products, inaccurate entry of products into point-of-sale systems, or even simple human error at the point of purchase. Thus, there is a slight margin of error to consider. Brands listed on this page are ranked in the top twenty within the market and product category by total retail sales volume.

