.svg)

Sep-2026
Sales
Trend
6-Month
Product Count
SKUs
Avg Price
YoY Sales Change
YoY Price Change


Market Insights Snapshot
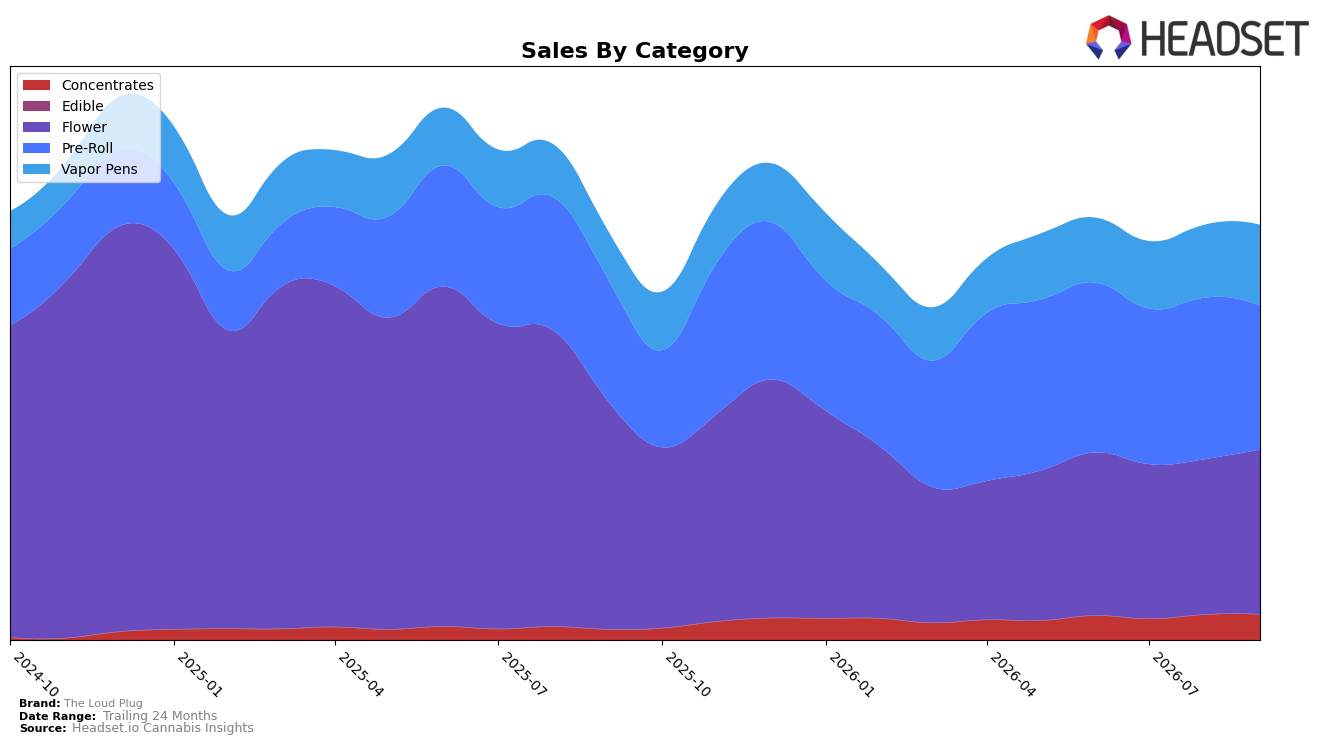
In September 2026, The Loud Plug’s category mix tilted toward Flower at 39.70% share (ranked 10 in British Columbia Flower), even as Flower sales fell 27.87% year over year and rose 6.00% month over month; Vapor Pens climbed to 19.49% share with 67.40% year-over-year growth and a 10.91% month-over-month increase. Pre-Roll held 34.74% share with 18.31% year-over-year growth but declined 10.88% month over month, while Concentrates reached 6.06% share with 149.73% year-over-year growth and a 1.09% month-over-month uptick. With brand-level sales up 1.54% year over year but down 13.66% over 24 months and average price down 10.05% year over year to $43.22, the pattern implies a pivot from a contracting Flower base toward faster-growing inhalables to sustain volume.
The simultaneous 27.87% year-over-year drop in Flower and 18.31% growth in Pre-Roll, alongside 67.40% in Vapor Pens and 149.73% in Concentrates, suggests The Loud Plug is trading mix toward formats with higher velocity, while the 10.88% month-over-month decline in Pre-Roll and 10.91% increase in Vapor Pens indicate near-term substitution rather than total category expansion. Holding the 10th rank in British Columbia Flower while Vapor Pens expand points to a positioning that uses Flower scale to anchor shelf presence and redirects demand to cartridges and concentrates, implying price-led customer migration that stabilizes year-over-year sales despite a 24‑month contraction.
Competitive Landscape
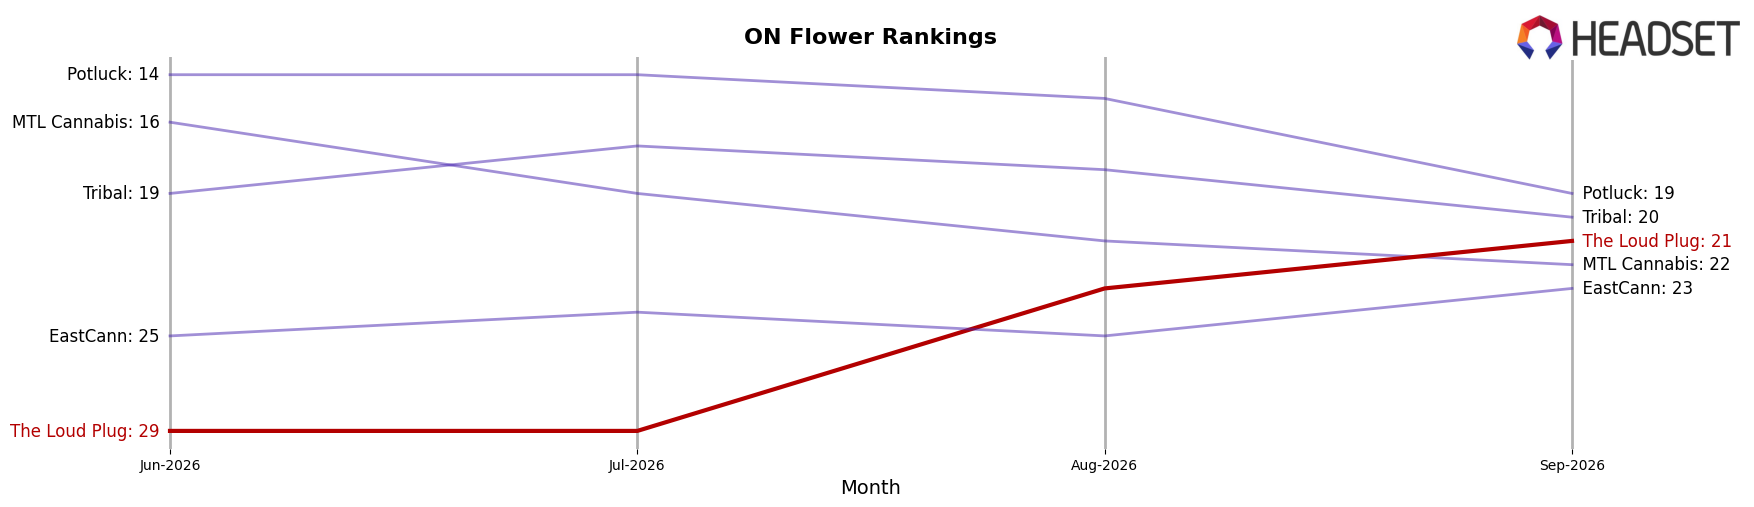
The Loud Plug sits at rank #21 in Ontario Flower for September 2026, down 4 positions year over year from #17, but up 8 positions versus June 2026 when it was #29; meanwhile, category leaders moved in the opposite direction, with Spinach climbing from #3 to #1 and posting a 15.7% YoY sales increase, while Back Forty / Back 40 Cannabis slid from #1 to #3 alongside a 7.4% YoY decline. The Loud Plug’s current #21 standing versus a prior peak of #7 in December 2024, coupled with its quarter-over-quarter rise from #29 to #21, indicates mid-pack recovery is underway but the YoY drop of 4 ranks suggests share is consolidating toward top movers, implying The Loud Plug must convert recent quarterly momentum into sustained rank gains to re-enter the top 15.
Notable Products
Cocolato Live Resin Disposable (1g) posted the standout move in September 2026 with +76.8% month over month to rank 3, while Drippyz Variety Pack Infused Pre-Roll 5-Pack (2.5g) fell 28.6% to rank 5. Despite the Drippyz Liquid Diamonds & Kief Infused Pre-Roll 5-Pack (2.5g) holding rank 1 with a -3.9% dip, Vapor Pens now claim two of the top eight and one of the top three, signaling a category tilt even as Flower places two SKUs in the top 10. The concentration of three Pre-Roll SKUs in the top 10 contrasts with mixed momentum in that segment, as one SKU declines 28.6% while another slips 3.4%, whereas Vapor Pens include a large positive outlier at +76.8% and a modest riser at +1.4%. The pattern implies The Loud Plug is leaning into higher-velocity inhalables led by Vapor Pens, reallocating attention from breadth in Pre-Rolls toward fewer SKUs with sharper month-to-month upside.
Top Selling Cannabis Brands






Data for this report comes from real-time sales reporting by participating cannabis retailers via their point-of-sale systems, which are linked up with Headset’s business intelligence software. Headset’s data is very reliable, as it comes digitally direct from our partner retailers. However, the potential does exist for misreporting in the instance of duplicates, incorrectly classified products, inaccurate entry of products into point-of-sale systems, or even simple human error at the point of purchase. Thus, there is a slight margin of error to consider. Brands listed on this page are ranked in the top twenty within the market and product category by total retail sales volume.

