Market Insights Snapshot
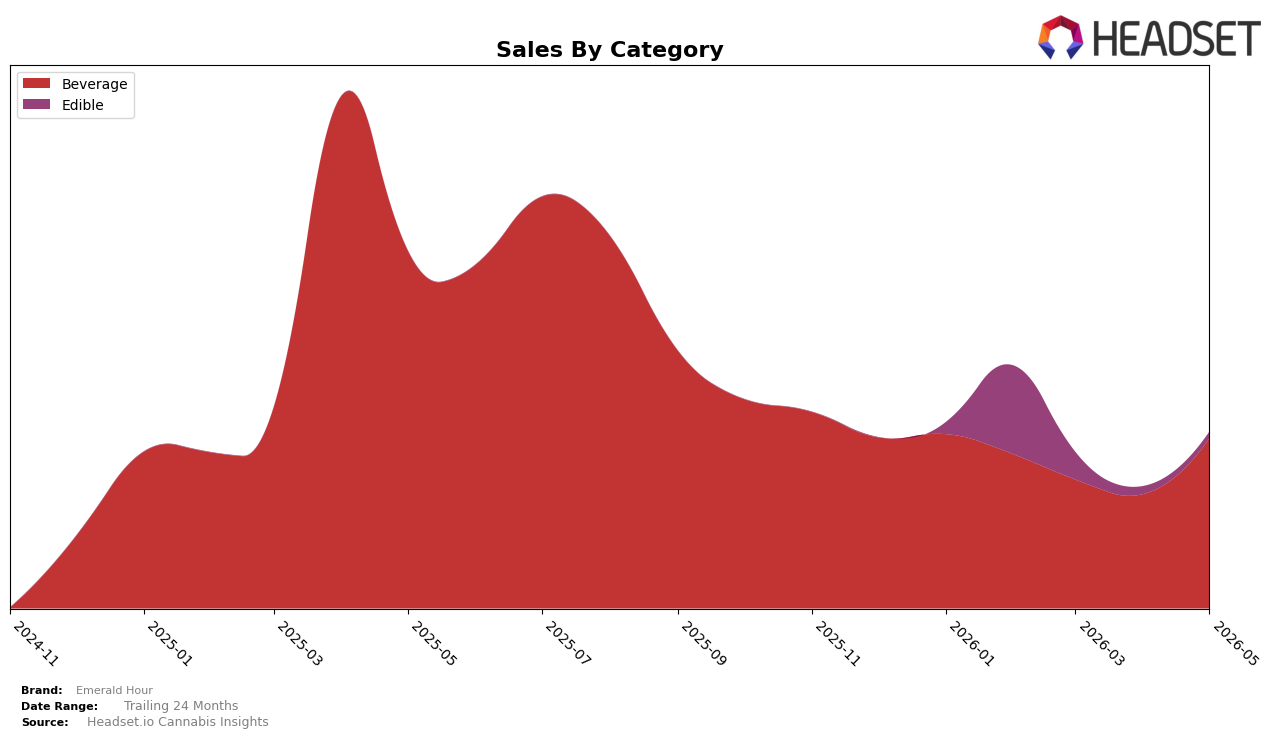
Emerald Hour concentrated 96.40% of May 2026 sales in Beverage while Edible held 3.60%, with Beverage up 48.89% month over month but down 52.58% year over year, and Edible down 16.90% month over month with no year-over-year basis. Average price fell 3.59% year over year to $7.50 while Beverage’s average ticket sat at $7.51, indicating mix and pricing both moved; combined with a 50.81% brand-level year-over-year decline and a rank of 29 in Beverage in Ontario, the pattern implies the brand leaned into Beverage volume recovery month over month without reversing the longer-year decline, leaving minimal diversification from Edible to buffer volatility.
The sharp 48.89% month-over-month Beverage lift alongside a 16.90% month-over-month Edible contraction and a 3.59% price decline implies Emerald Hour is competing more on throughput than ticket, prioritizing Beverage share of 96.40% at the expense of breadth. With rank 29 in Beverage in Ontario and a 52.58% Beverage year-over-year drop against a 50.81% brand decline, positioning skews toward regaining velocity via price-accessible Beverage SKUs rather than incremental Edible penetration; this suggests near-term gains will depend on sustaining month-over-month Beverage momentum while selectively testing Edible to reduce category concentration risk.
Competitive Landscape
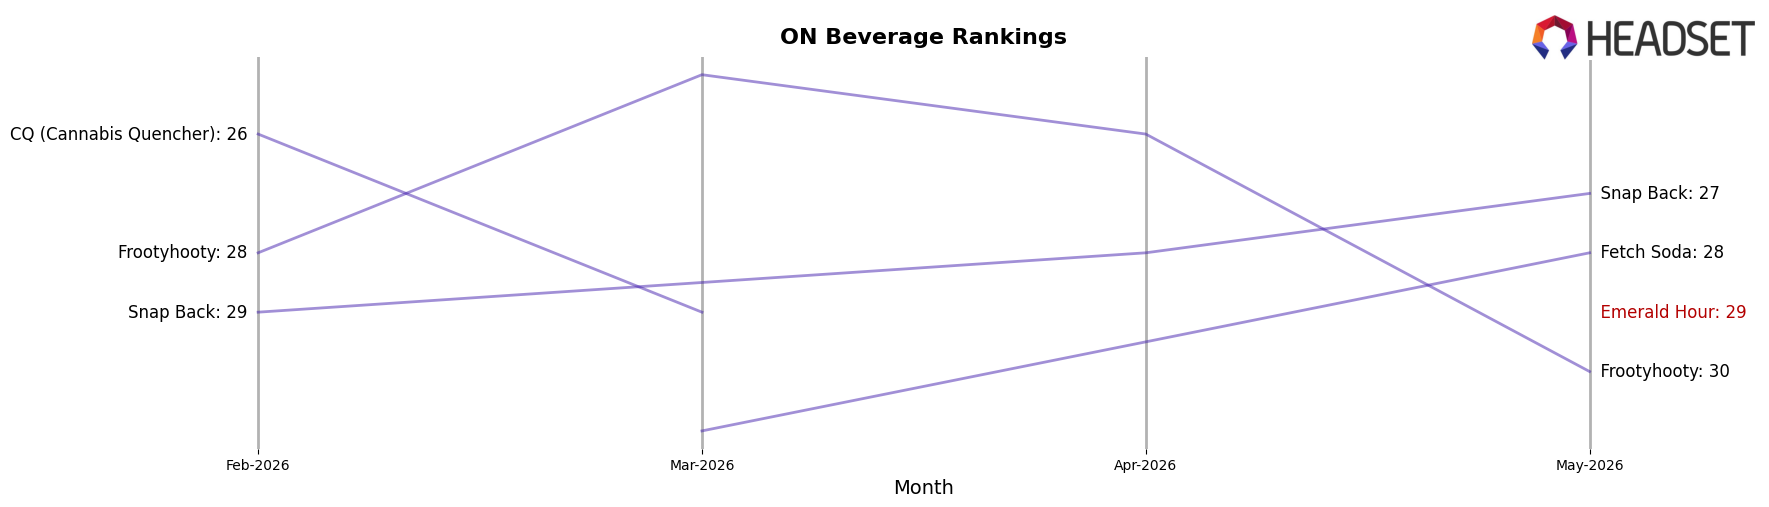
Emerald Hour sits at #29 in ON Beverage in May 2026, slipping 1 rank position year over year from #28 while improving 5 spots versus February 2026 when it was #34; the brand’s peak of #21 in July 2025 frames an 8-position retreat from its high-water mark. Competitors moved in sharper directions: Mollo edged up from #4 to #3 with a 4.6% YoY sales increase, while Ray's Lemonade advanced from #7 to #4 alongside a 31.9% YoY lift, and TeaPot surged from #10 to #5 with 175.2% YoY growth, even as XMG held #1 despite a 29.6% YoY sales decline. The combination of a 1-rank YoY dip and a 5-rank recovery since February 2026 implies Emerald Hour is stabilizing mid-pack while faster-rising rivals compress headroom, signaling that holding share will require outpacing category climbers rather than merely avoiding further rank loss.
Notable Products
Ginger Lime Soda (10mg THC, 222ml) posted the standout move in May 2026 with a 165.6% month-over-month surge into rank 4, while Peach White Grape Gummies 2-Pack (10mg) fell 16.9% to rank 3. Cranberry Citrus Live Rosin Soda (10mg THC, 222ml) rose 49.5% to hold rank 1, and Agave Lime Sea Salt Live Rosin Soda (10mg THC, 222ml) climbed 40.5% to rank 2, with beverage SKUs occupying four of the top five positions. This pattern signals a strategic skew toward beverages as the commercial growth engine, with edibles deprioritized in near-term merchandising and innovation.
Top Selling Cannabis Brands
Data for this report comes from real-time sales reporting by participating cannabis retailers via their point-of-sale systems, which are linked up with Headset’s business intelligence software. Headset’s data is very reliable, as it comes digitally direct from our partner retailers. However, the potential does exist for misreporting in the instance of duplicates, incorrectly classified products, inaccurate entry of products into point-of-sale systems, or even simple human error at the point of purchase. Thus, there is a slight margin of error to consider. Brands listed on this page are ranked in the top twenty within the market and product category by total retail sales volume.

