Market Insights Snapshot
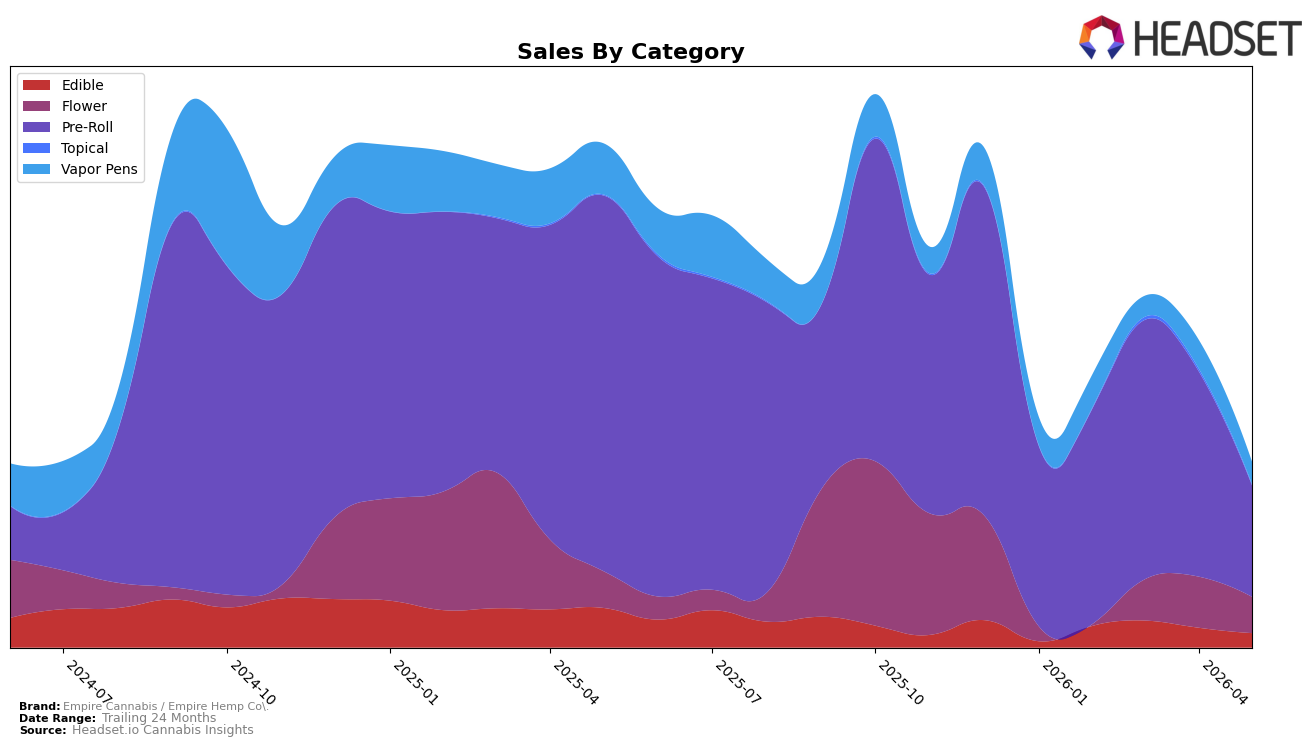
Empire Cannabis / Empire Hemp Co. concentrated 60.30% of May-2026 sales in Pre-Roll, with that category down 70.41% year over year and 45.82% month over month, while Flower at 19.49% share declined just 1.39% YoY but fell 29.25% MoM. Vapor Pens held 11.99% share with sales down 56.54% YoY and 22.24% MoM, and Edible at 7.72% share dropped 63.92% YoY and 27.45% MoM; Topical was 0.51% share, up 46.74% YoY but down 61.66% MoM. With overall brand sales down 63.35% YoY and average price down 6.26% YoY to $24.19, the mix skews toward categories with the steepest annual and monthly contractions, implying the brand’s current portfolio concentration is amplifying total decline in New York.
The divergence between Pre-Roll’s 60.30% share and its 70.41% YoY contraction versus Flower’s 19.49% share and 1.39% YoY dip indicates overexposure to a rapidly shrinking pillar while a relatively steadier category remains underweighted. The 22.24% MoM drop in Vapor Pens alongside a 27.45% MoM decline in Edible suggests inhalables and ingestibles are both soft, but the 61.66% MoM fall in Topical despite a 46.74% YoY gain shows low-consistency traction that cannot offset core losses. Net, the pattern implies May-2026 positioning is misaligned: reallocating toward Flower and away from Pre-Roll could reduce volatility and narrow the 63.35% YoY brand decline in New York, while price mix adjustments are unlikely to be the primary lever given only a 6.26% YoY price decrease.
Competitive Landscape
Empire Cannabis / Empire Hemp Co. sits at rank #151 in NY Pre-Roll in May 2026, a drop of 78 positions from #73 year over year and 53 positions from #98 three months ago, while its best historical position was #56 in September 2024. In contrast, Ruby Farms holds #1 now with a 21.7% YoY sales increase, and Anthem surged from #60 YoY to #4 with 1311.3% YoY sales growth, indicating competitors are converting momentum into higher rank as Empire declines across both 12-month and 3-month windows. The implication is that Empire’s rank trajectory signals erosion of visibility and shelf priority unless distribution, assortment, or promotional intensity are reset to counter rapid share consolidation at the top.

Notable Products
Mount'N Dew Haze Infused Pre-Roll (2g) posted the steepest movement in May 2026 with a -53.1% month-over-month drop while holding rank 1, and Cherry Galaxy Infused Pre-Roll (2g) also contracted by -43.5% from a shared rank 2 position, indicating top-ranked volume is not translating to momentum. Big Bush Kush Infused Pre-Roll (2g) fell -11.9% at rank 2, while Strawberry Cough Distillate Cartridge (0.5g) was the exception with +10.3% at rank 4 against Wedding Cake Distillate Cartridge (0.5g) at -12.1% from the same rank, pointing to uneven traction within Vapor Pens. Three of the top ten are Infused Pre-Roll SKUs concentrated at ranks 1–3, yet concurrent declines of -53.1%, -43.5%, and -11.9% suggest over-reliance on a weakening format despite a $7,888 anchor from the category leader. The pattern implies a pivot opportunity toward select Vapor Pens while diversifying away from Infused Pre-Rolls to stabilize rank positions and reduce exposure to double-digit declines.
Top Selling Cannabis Brands
Data for this report comes from real-time sales reporting by participating cannabis retailers via their point-of-sale systems, which are linked up with Headset’s business intelligence software. Headset’s data is very reliable, as it comes digitally direct from our partner retailers. However, the potential does exist for misreporting in the instance of duplicates, incorrectly classified products, inaccurate entry of products into point-of-sale systems, or even simple human error at the point of purchase. Thus, there is a slight margin of error to consider. Brands listed on this page are ranked in the top twenty within the market and product category by total retail sales volume.

