Jun-2026
Sales
Trend
6-Month
Product Count
SKUs
Avg Price
YoY Sales Change
YoY Price Change
Market Insights Snapshot
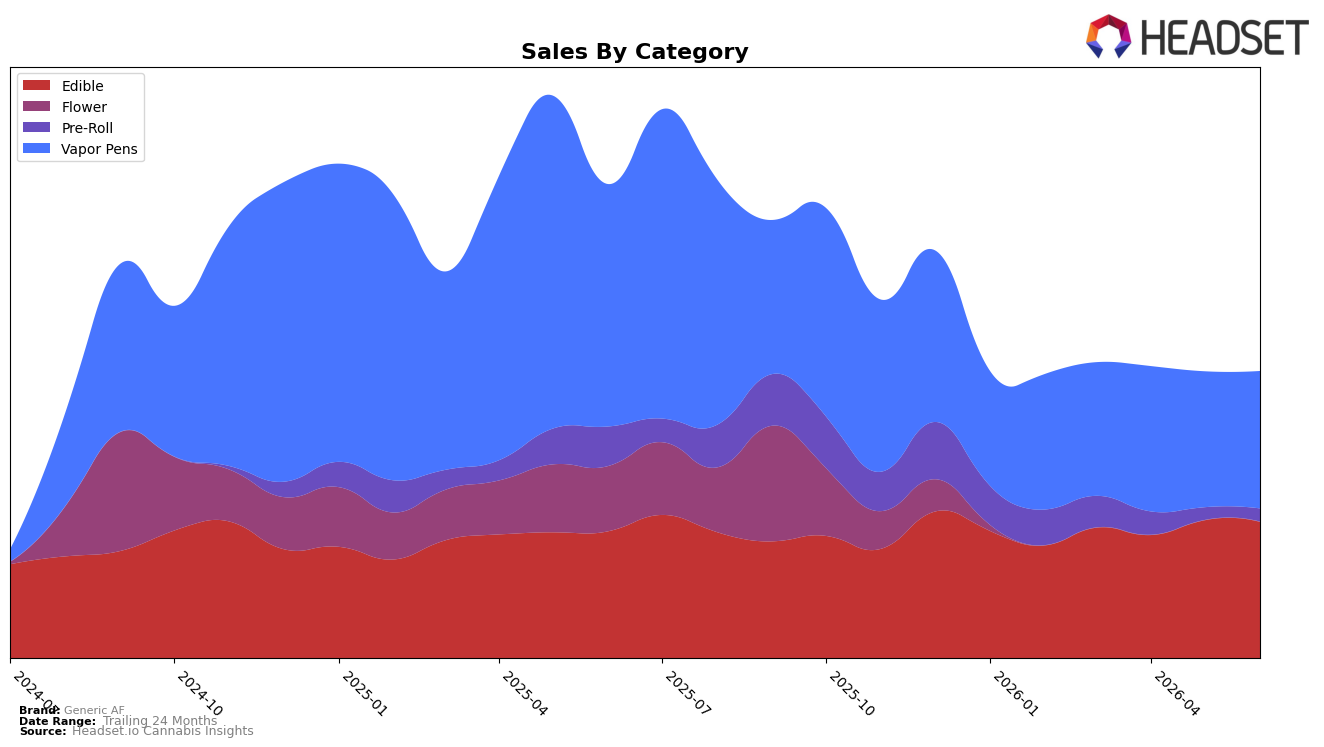
Generic AF split its June 2026 mix almost evenly between Vapor Pens at 47.9% share and Edible at 47.6% share, with Pre-Roll a distant 4.5% share; the brand’s total year-over-year sales fell 39.5% even as Vapor Pens declined 43.4% YoY and Edible grew 7.4% YoY. Month over month, Vapor Pens inched up 1.1% while Edible slipped 1.2%, and Pre-Roll rose 3.3% despite a 67.3% YoY drop; average price fell 18.3% YoY to $22.19, while Vapor Pens carried a $28.27 average and Edible held at $18.33. With Vapor Pens ranked 40th in Illinois and losing YoY volume faster than the brand overall, the pattern implies a pivot toward Edible for stability while using marginal MoM gains in Vapor Pens to defend shelf presence.
The tilt toward Edible growth at 7.4% YoY alongside a 1.1% MoM lift in Vapor Pens suggests a barbell where Edible sustains baseline turns and Vapor Pens targets incremental, promotion-driven traffic; the 18.3% price drop concentrated against higher-priced Vapor Pens likely compressed mix margin even as Edible’s 47.6% share buffered unit throughput. Given the 40 rank in Illinois Vapor Pens and a 43.4% YoY decline there, the near-parity shares signal that pushing Edible toward a majority share above 50% while preserving a 1–2 point monthly gain in Vapor Pens is the practical route to stabilize total sales trajectory and reduce sensitivity to high-ticket price elasticity.
Competitive Landscape
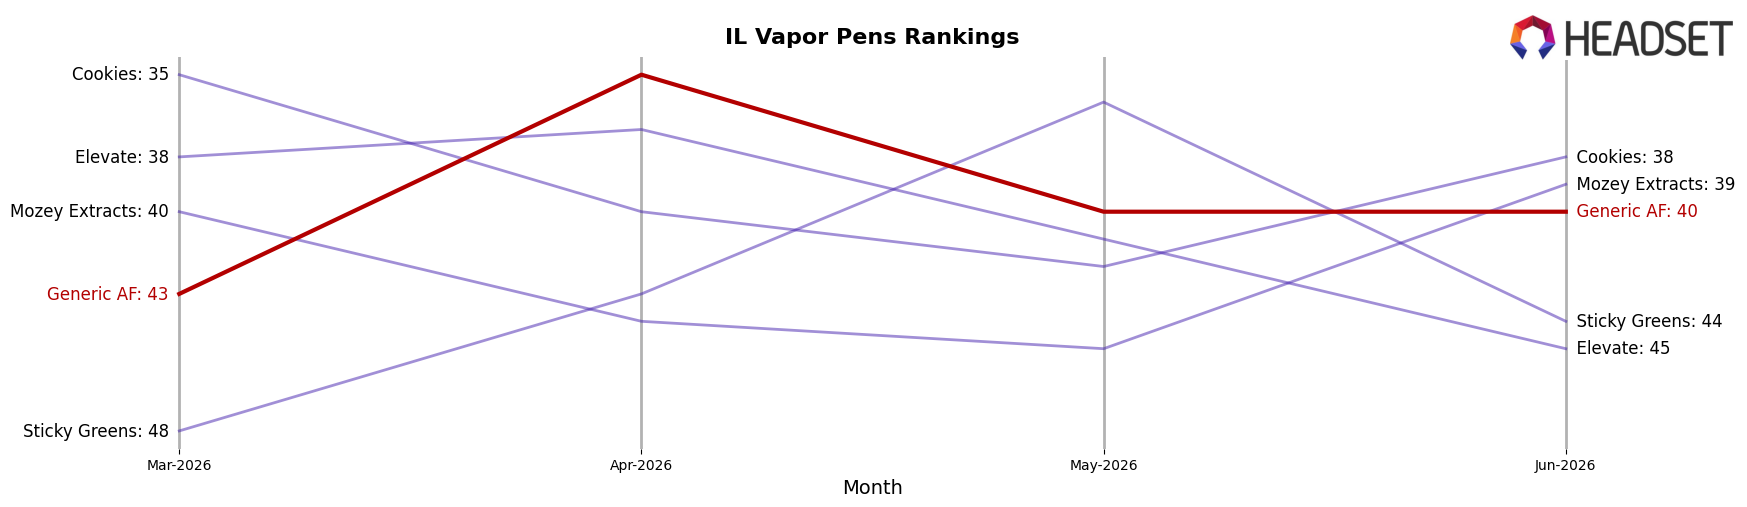
Generic AF sits at rank #40 in IL Vapor Pens in June 2026, down 11 positions year over year from #29 and up 3 places since March 2026 from #43, with its peak at #22 in January 2025 indicating a 18-rank slide from that high; meanwhile, &Shine held #1 while its sales fell 12.7% year over year and Select stayed at #2 with a 6.8% sales decline, implying that Generic AF’s rank erosion despite pressure at the very top signals brand-specific share leakage rather than broad category contraction.
Notable Products
Cherry Gummies 20-Pack (100mg) posted the most abrupt movement in June 2026 with a month-over-month increase of 64.5% while holding rank 3, contrasting with Blue Raspberry Gummies 20-Pack (100mg) at rank 1 falling 13.6%. Blue Dream Distillate Cartridge (1g) slid 12.7% to rank 2, whereas Skywalker OG Distillate Cartridge (1g) rose 10.4% at rank 4. Four of the top ten are Edible SKUs, and five are Vapor Pens, indicating a split mix where gummies volatility is starting to pull attention away from a softening vape leader.
Top Selling Cannabis Brands
Data for this report comes from real-time sales reporting by participating cannabis retailers via their point-of-sale systems, which are linked up with Headset’s business intelligence software. Headset’s data is very reliable, as it comes digitally direct from our partner retailers. However, the potential does exist for misreporting in the instance of duplicates, incorrectly classified products, inaccurate entry of products into point-of-sale systems, or even simple human error at the point of purchase. Thus, there is a slight margin of error to consider. Brands listed on this page are ranked in the top twenty within the market and product category by total retail sales volume.

