.svg)


Where to Buy
Enliven Edibles is stocked at 84 licensed dispensaries across Illinois, with the deepest coverage in Chicago, East Dubuque, Springfield, Collinsville, and Darien. Search by ZIP code or city below to find the closest one.
Market Insights Snapshot
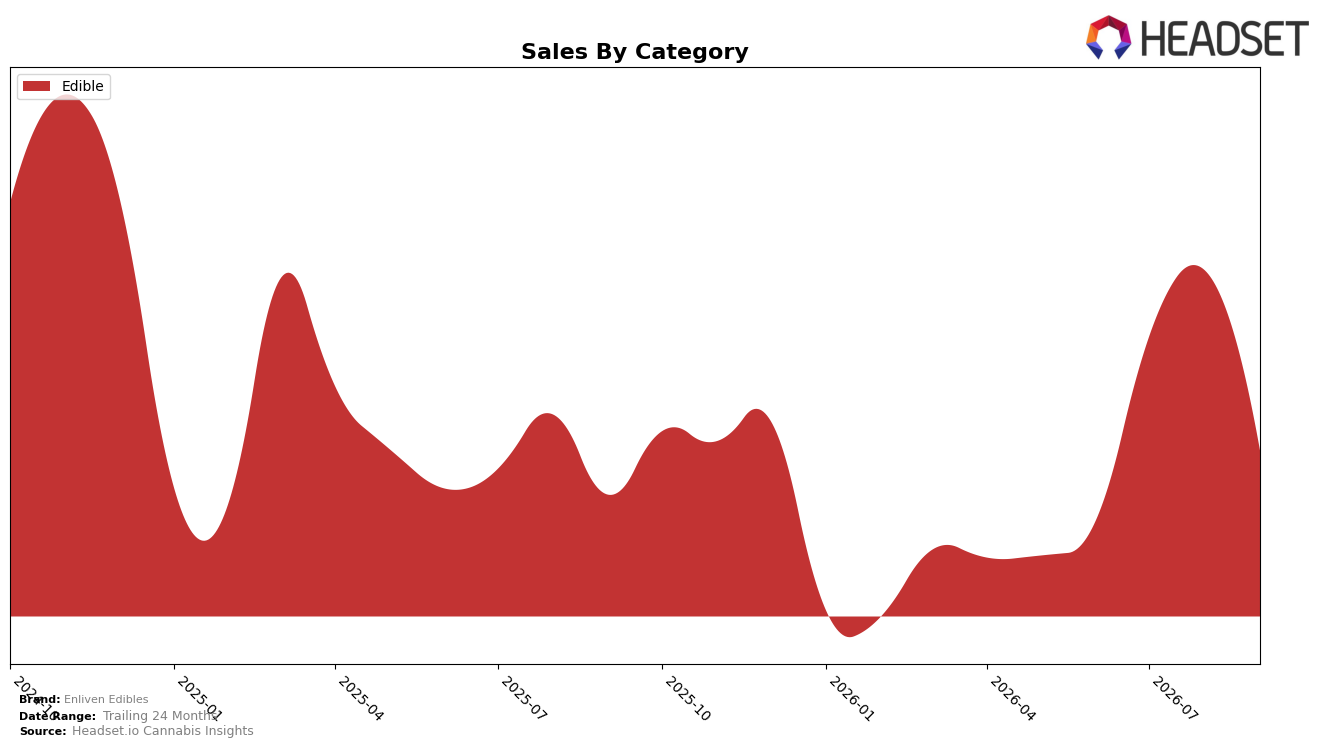
Enliven Edibles operated as a single-category brand in September 2026, with Edible accounting for 100.0% of sales, posting a year-over-year change of 11.2% alongside a month-over-month decline of 29.0%. Average price moved down 2.3% YoY to $13.72 while category share remained concentrated at 100.0%, and Illinois placement sat at rank 31 within Edible. The pattern implies a demand mix that is fully concentrated in Edible, benefiting YoY but exposed to intra-quarter volatility and mid-pack ranking pressure in Illinois.
The combination of a 100.0% category concentration and rank 31 within Edible suggests positioning that depends on depth rather than breadth, with pricing latitude limited by a 2.3% YoY price decline and a 29.0% MoM sales pullback. With brand sales up 11.2% YoY but down 44.9% over 24 months, the trajectory indicates a rebound within Edible that has not reset longer-horizon share, so retaining or improving rank will likely hinge on stabilizing MoM demand while maintaining price discipline at an average of $13.72.
Competitive Landscape
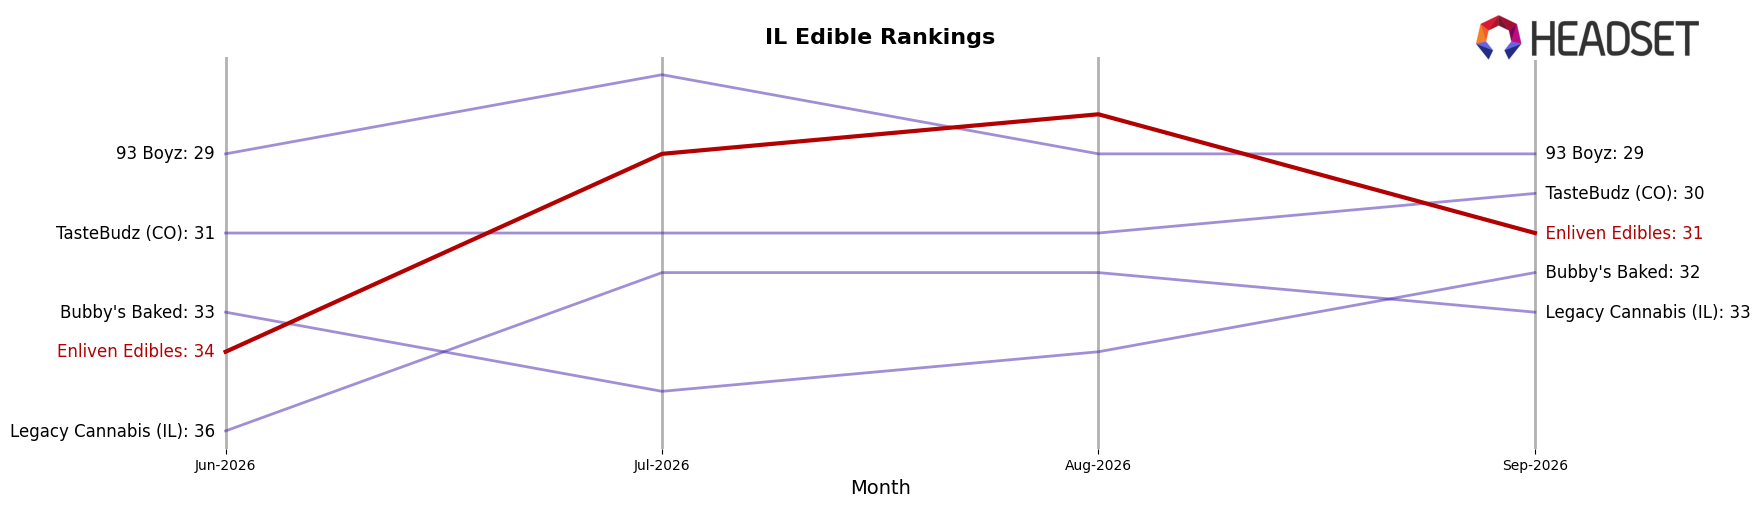
Enliven Edibles sits at rank #31 in IL Edible for September 2026, unchanged YoY from #31, while improving 3 positions versus June 2026 from #34 to #31; this stability contrasts with Incredibles moving up from #2 to #1 and posting a 19.5% YoY sales increase, and diverges from Wyld sliding from #1 to #3 with a −8.0% YoY change. Against a field where Wana climbed from #3 to #2 with a 1.5% YoY lift and Gron / Grön held at #5 with a 10.7% YoY gain, Enliven Edibles remains 7 ranks below its peak of #24 in September 2024 and has not converted minor quarter-on-quarter rank recovery into YoY advancement; the pattern implies a plateau where incremental near-term gains are insufficient to re-enter the top 25 without capturing share from rising leaders.
Notable Products
Sleep - THC/CBN 1:1 Midnight Berry Sour Gummy Worms 10-Pack (100mg THC, 100mg CBN) posted the steepest decline at -60.2% MoM while holding rank 5, signaling sharp cooling in sleep-focused demand relative to the broader lineup where Fruity Flintstoned Cereal Bar 5-Pack (100mg) jumped +174.0% MoM to rank 1. Boost - THC/CBG 1:1 Sunrise Punch Sour Gummy Worms 10-Pack (100mg THC, 100mg CBG) also fell -44.2% MoM at rank 2, whereas Reset - CBD/THC 1:1 Sour Gummy Worms 10-Pack (100mg CBD, 100mg THC) slipped a milder -4.2% at rank 3. With multiple top-10 placements coming from gummies while two cereal bars sit at ranks 1 and 4, the pattern implies a pivot toward higher-velocity confection formats led by cereal bars as functional gummy sublines retrench.
Top Selling Cannabis Brands






Data for this report comes from real-time sales reporting by participating cannabis retailers via their point-of-sale systems, which are linked up with Headset’s business intelligence software. Headset’s data is very reliable, as it comes digitally direct from our partner retailers. However, the potential does exist for misreporting in the instance of duplicates, incorrectly classified products, inaccurate entry of products into point-of-sale systems, or even simple human error at the point of purchase. Thus, there is a slight margin of error to consider. Brands listed on this page are ranked in the top twenty within the market and product category by total retail sales volume.

