Jun-2026
Sales
Trend
6-Month
Product Count
SKUs
Avg Price
YoY Sales Change
YoY Price Change
Market Insights Snapshot
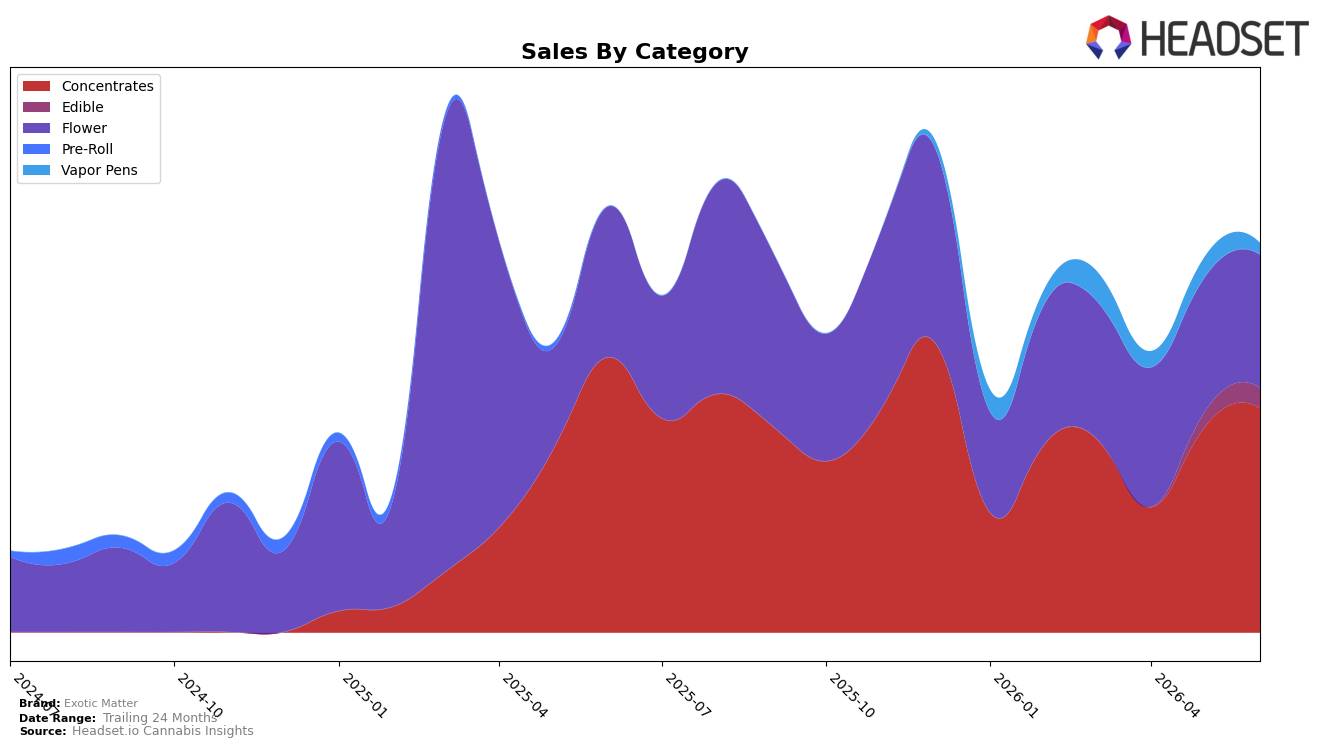
Exotic Matter concentrated 57.76% of June 2026 sales in Concentrates, with Flower at 34.20%, Edible at 5.17%, and Vapor Pens at 2.87%, indicating a tilt toward high-potency formats; within June 2026, Concentrates grew 9.21% MoM while Flower slipped 1.01% MoM, and Edible surged 35.59% MoM as Vapor Pens fell 44.34% MoM. Year over year, Concentrates declined 18.48% and Flower fell 11.62%, while the brand’s total sales were down 8.72% YoY and average price fell 42.43% to $26.96, implying mix resilience is coming from intra-month demand shifts despite category-level contraction. In Michigan Concentrates, the brand sits at rank 21, which, alongside a 9.21% MoM lift in Concentrates and a 1.01% MoM dip in Flower, implies a tactical advantage in deepening share where short-term momentum exists even as annual comps remain negative.
The mix pivot toward Concentrates (+9.21% MoM) and Edible (+35.59% MoM) alongside Vapor Pens’ 44.34% MoM drop suggests price-led trade-down is favoring categories where Exotic Matter can price aggressively while preserving potency perception; the 42.43% YoY price decline paired with an 8.72% YoY sales contraction indicates volume elasticity is present but not fully offsetting category headwinds. Given rank 21 in Michigan Concentrates and a 57.76% share of brand sales from that category versus a 34.20% share from Flower, the positioning thesis is to concentrate assortment and promotional depth in Concentrates while pruning low-velocity Vapor Pens, because the mix already concentrates demand where the brand’s relative ranking is workable and where month-on-month traction outpaces Flower’s -1.01%.
Competitive Landscape
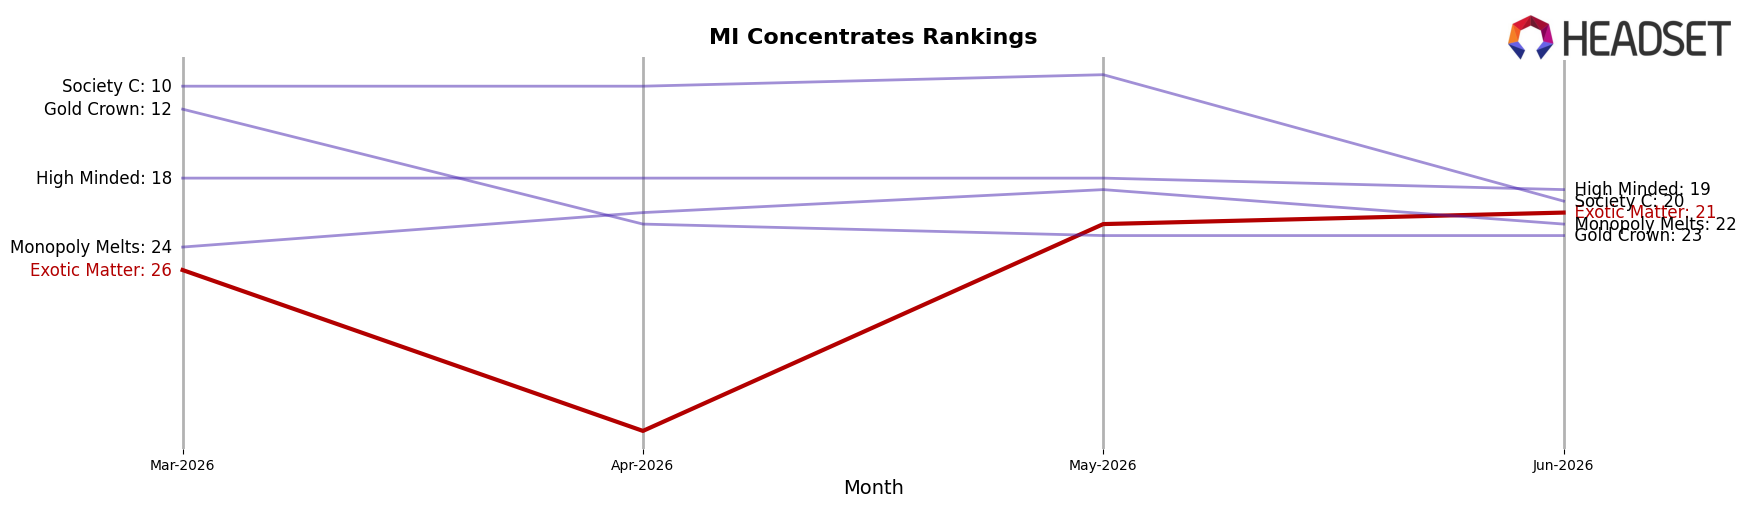
Exotic Matter sits at rank #21 in MI Concentrates in June 2026, down 5 positions year over year from #16 and up 5 positions versus March 2026’s #26; compared to a peak of #14 reached in December 2025, the brand is 7 spots lower, indicating slippage from its prior high. Competitors moved in the opposite direction at the top: The Limit held #1 from last year’s #1 while posting a 3.9% sales increase, and Rkive Cannabis advanced from #4 to #2 alongside a 101.3% sales gain, while Uniq Pressure surged from #133 to #4 with a 3338.0% sales jump; the directional gap—Exotic Matter drifting from #16 to #21 as peers climb multiple ranks—implies share is consolidating toward faster risers and that maintaining the current trajectory would cede further rank unless mix or velocity shifts.
Notable Products
Blue Dream 2.0 (7g) led June 2026 with a 181.7% month-over-month surge to rank 1, while Lemoya Live Rosin (2g) fell 36.97% and Exotic Matter x Yeti Stash - Banana Candy Rosin (2g) declined 23.36%, indicating a pivot in shopper preference toward a single Flower SKU over several Concentrates at ranks 7–8. Papaya Rosin (2g) jumped 91.39% to rank 5 even as Trop Strawberry Hash Rosin Gummies 10-Pack (200mg) rose 64.87% to rank 4, and four of the top ten are Concentrates, implying rising volatility within that category rather than a uniform slide. The spread between a rank-1 Flower surge and mixed Concentrates outcomes at ranks 5, 7, and 8 suggests promotional or inventory-driven wins are concentrating demand into fewer hero SKUs rather than lifting the whole portfolio. This pattern implies Exotic Matter is tilting toward a hero-led mix anchored by Blue Dream 2.0 (7g), with Concentrates acting as opportunistic spikes rather than consistent volume drivers.
Top Selling Cannabis Brands
Data for this report comes from real-time sales reporting by participating cannabis retailers via their point-of-sale systems, which are linked up with Headset’s business intelligence software. Headset’s data is very reliable, as it comes digitally direct from our partner retailers. However, the potential does exist for misreporting in the instance of duplicates, incorrectly classified products, inaccurate entry of products into point-of-sale systems, or even simple human error at the point of purchase. Thus, there is a slight margin of error to consider. Brands listed on this page are ranked in the top twenty within the market and product category by total retail sales volume.

