.svg)


Where to Buy
Bamn is stocked at 132 licensed dispensaries across Michigan, with the deepest coverage in New Buffalo, Detroit, Monroe, Kalamazoo, and Ann Arbor. Search by ZIP code or city below to find the closest one, or filter by product type if you are after a specific format.
Market Insights Snapshot
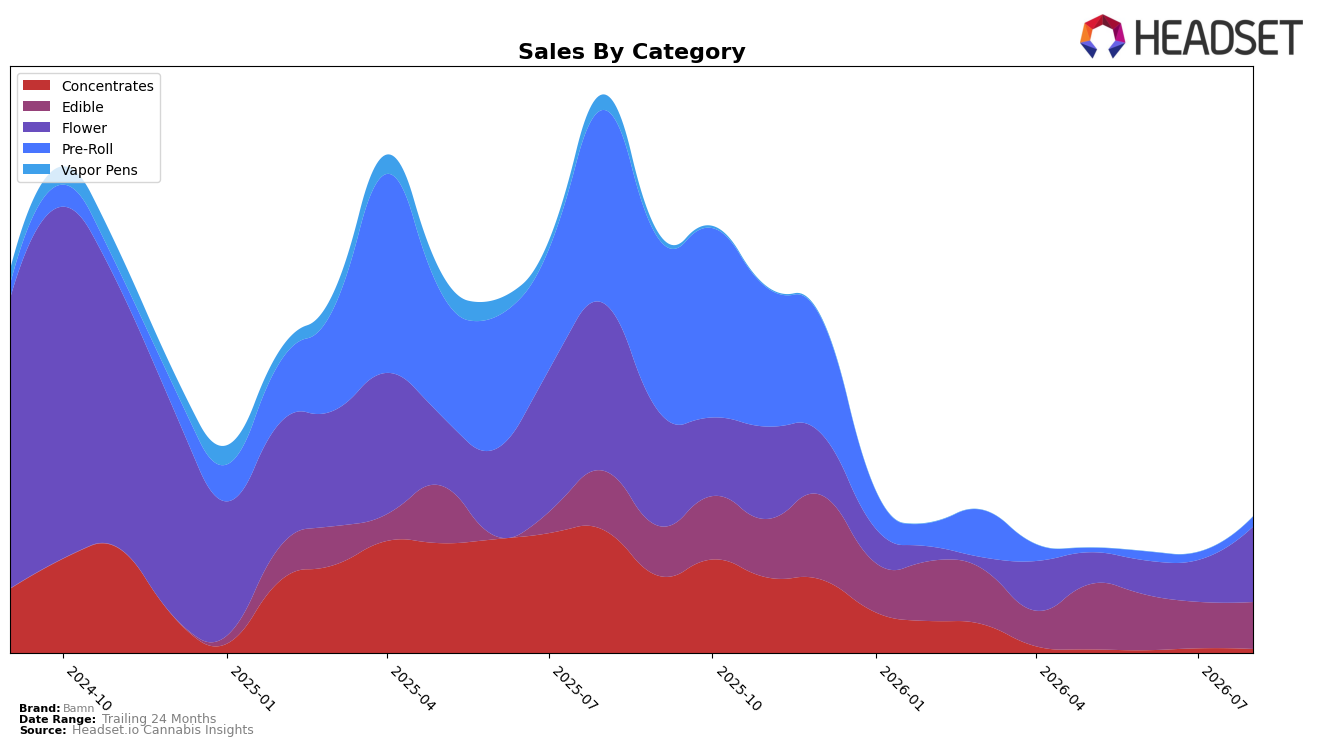
In August 2026, Bamn’s mix tilted heavily to Flower at 55.45% share with a month-over-month gain of 80.73% but a year-over-year decline of 55.11%, while Edible held 34.43% share with a modest 1.04% MoM increase and a 20.96% YoY decline. Pre-Roll contributed 7.24% share after a 28.26% MoM lift against a 94.93% YoY drop, and Concentrates fell 14.18% MoM with a 96.83% YoY decline, leaving just 2.88% share. With brand sales down 75.72% YoY and average price up 21.62%, the pattern implies Bamn is reallocating toward quicker-recovering Flower and stabilizing Edible to rebuild volume while pruning underperforming Concentrates despite a rising price posture.
These shifts reposition Bamn toward a two-pillar portfolio in Flower and Edible, using an 80.73% MoM surge in Flower and a 1.04% MoM rise in Edible to offset steeper YoY attrition of 55.11% and 20.96%, respectively, while containing exposure to Pre-Roll and Concentrates where YoY declines of 94.93% and 96.83% constrain scale. Given a 44 rank in Edible in Michigan alongside a 21.62% YoY average price increase, the mix signals a value-to-premium ladder: lean into Flower recovery to regain rank velocity and use Edible as a steadier base, while the retrenchment in Concentrates and only partial Pre-Roll rebound indicate selective participation rather than breadth-led growth.
Competitive Landscape
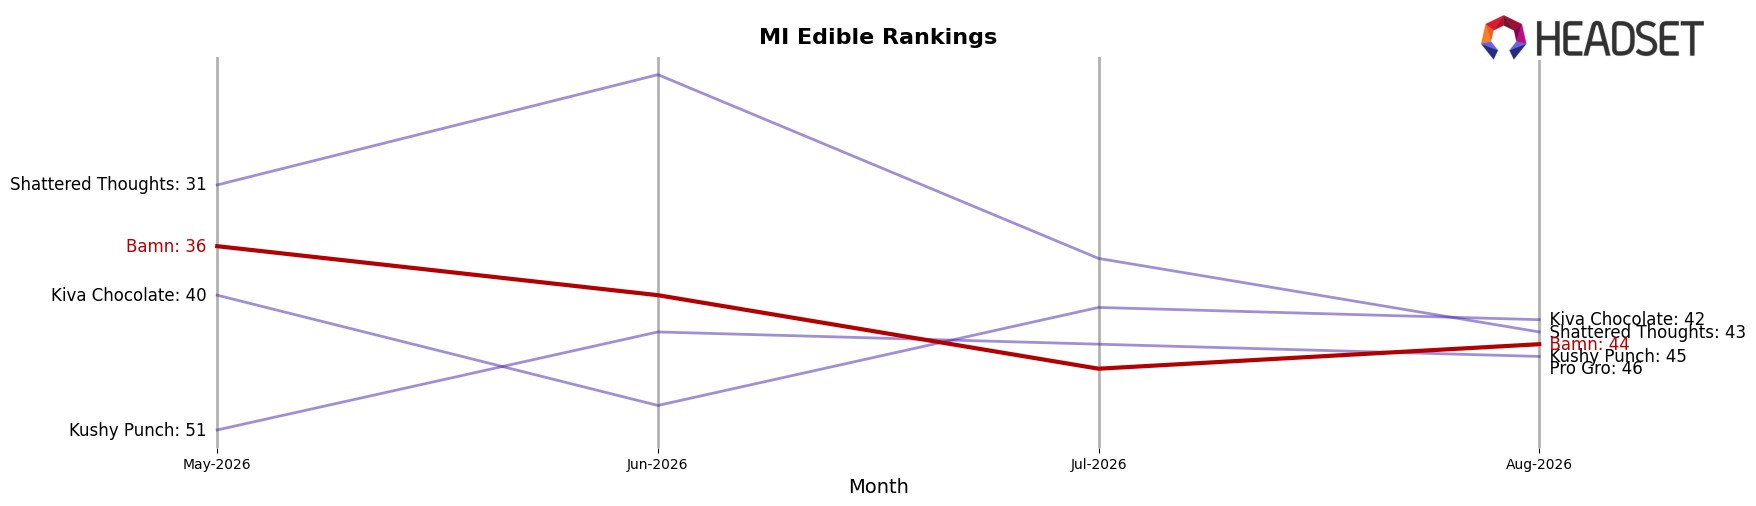
Bamn is ranked #44 in MI Edible in August 2026, down 2 positions year over year from #42 and sliding 8 spots since May 2026 when it was #36; this trails its peak of #30 in December 2025 by 14 ranks and contrasts with Wyld holding #1 despite a -22.8% YoY sales change while Camino climbed from #4 to #3 on +22.1% YoY. The combination of a 2-rank YoY decline and an 8-rank three-month drop, alongside competitors like Play Cannabis moving from #11 to #5 on +22.7% YoY, implies Bamn is losing relative momentum and must reverse recent share leakage to avoid further mid-tier drift.
Notable Products
Watermelon Gummy (200mg) delivered the standout move in August 2026 with a 103.7% month-over-month surge to rank 1, while Blue Razz Gummy (200mg) slipped 9.6% to rank 2 and Grape Gummy (200mg) fell 12.8% at rank 4. Three of the top five SKUs are Edibles, concentrating category power at the top even as Mango Gummies 10-Pack (200mg) eased 4.1% at rank 3. Despite that edible skew, Flower still anchors value with Garlic Funk (Bulk) at rank 6 posting $41,155 and category peers holding ranks 9 and 10, implying Bamn’s commercial direction is tilting toward high-velocity gummy flavors while bulk Flower sustains revenue depth.
Top Selling Cannabis Brands






Data for this report comes from real-time sales reporting by participating cannabis retailers via their point-of-sale systems, which are linked up with Headset’s business intelligence software. Headset’s data is very reliable, as it comes digitally direct from our partner retailers. However, the potential does exist for misreporting in the instance of duplicates, incorrectly classified products, inaccurate entry of products into point-of-sale systems, or even simple human error at the point of purchase. Thus, there is a slight margin of error to consider. Brands listed on this page are ranked in the top twenty within the market and product category by total retail sales volume.

