Market Insights Snapshot
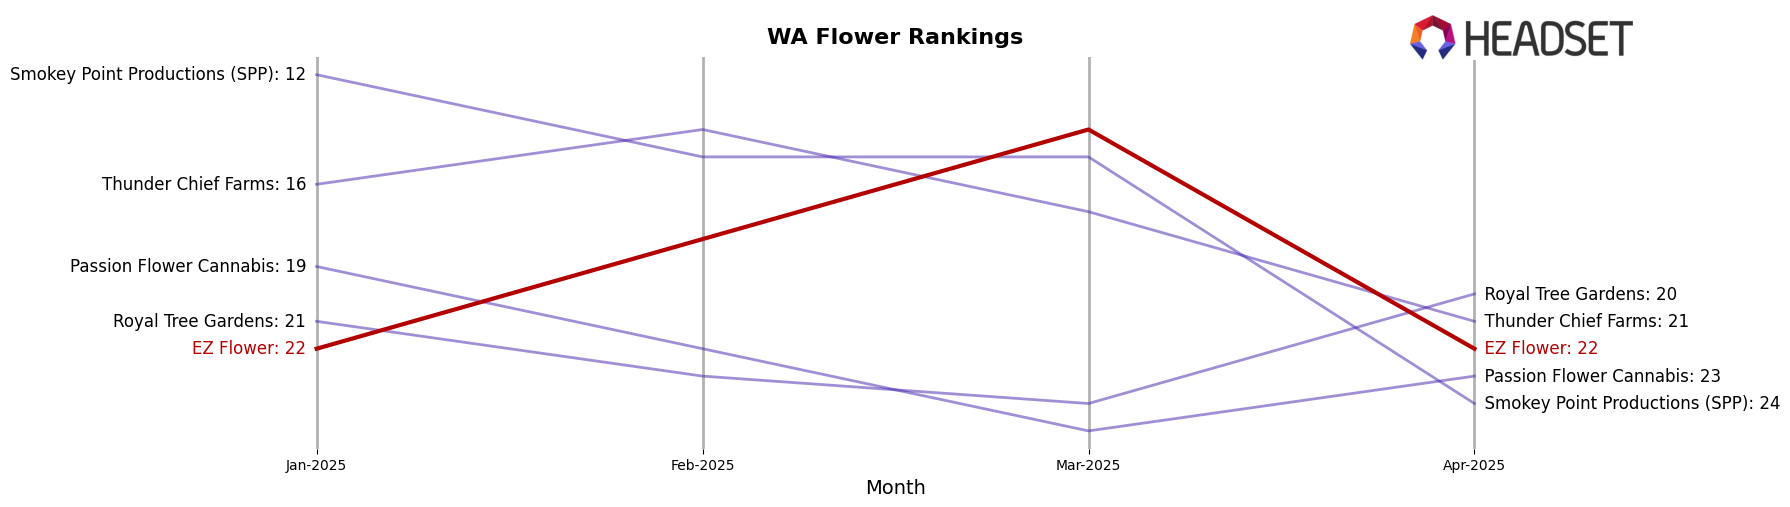
EZ Flower has shown varied performance across different states and categories, with noteworthy fluctuations in their rankings over the first four months of 2025. In Washington, the brand has experienced a rollercoaster ride in the Flower category. Starting at rank 22 in January, EZ Flower improved to rank 18 in February and further climbed to rank 14 in March, indicating a positive growth trend. However, by April, the brand slipped back to rank 22, suggesting possible challenges in maintaining its upward momentum. This oscillation in rankings could reflect changes in consumer preferences or increased competition within the state.
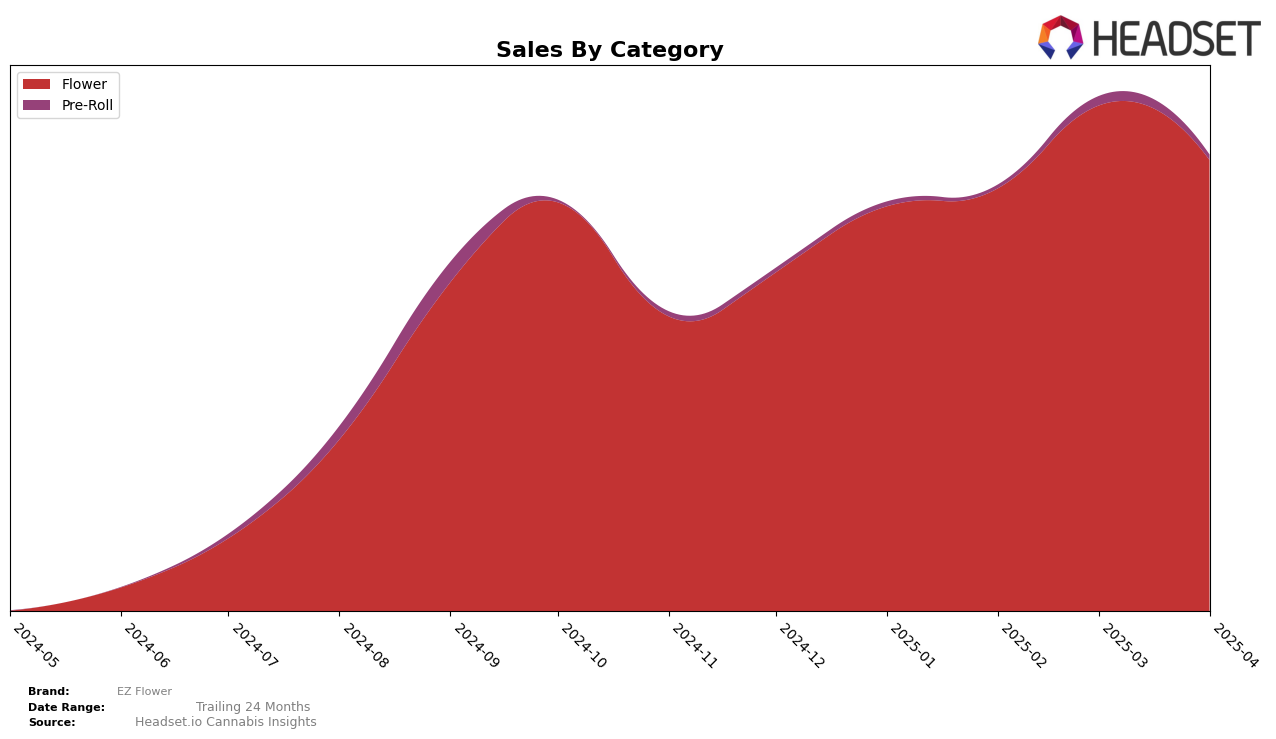
While EZ Flower has demonstrated the ability to climb the ranks, the inconsistency in maintaining higher positions highlights potential areas for strategic improvement. The brand's sales figures in Washington, for instance, show an increase from January to March, with a peak in March, before a decline in April, which aligns with the ranking fluctuations. This pattern suggests that while EZ Flower can capture market attention, sustaining that interest is crucial for long-term success. The absence of rankings in other states or categories indicates that EZ Flower has not yet penetrated the top 30 in those markets, presenting both a challenge and an opportunity for expansion and growth.
Competitive Landscape
In the competitive landscape of the Flower category in Washington, EZ Flower has experienced notable fluctuations in its ranking and sales performance from January to April 2025. Starting at rank 22 in January, EZ Flower improved to 18 in February and peaked at 14 in March, before dropping back to 22 in April. This indicates a temporary surge in market presence, likely driven by strategic marketing or product launches, but followed by a decline possibly due to increased competition or market saturation. Competitors such as Thunder Chief Farms and Smokey Point Productions (SPP) have shown more consistent rankings, although Smokey Point Productions (SPP) experienced a significant drop to rank 24 in April. Meanwhile, Royal Tree Gardens and Passion Flower Cannabis remained outside the top 20 for most of the period, suggesting that EZ Flower's competitive position is relatively strong despite the recent dip. These dynamics highlight the importance for EZ Flower to maintain momentum and address competitive pressures to sustain its market share in Washington.
Notable Products
For April 2025, Georgia Pie 3.5g maintained its leading position as the top-selling product from EZ Flower, despite a decrease in sales to 3042 units. Plasma Gas 3.5g emerged as a strong contender, securing the second position, marking its first appearance in the rankings. Gary Peyton 3.5g, consistently ranked second in the first three months of the year, slipped to third place in April. Gelonade 3.5g improved its ranking from fifth in March to fourth in April, while Dirty Sugah 3.5g re-entered the rankings in fifth place after being absent in March. These shifts indicate a dynamic market where new entrants and changing consumer preferences influence product performance.
Top Selling Cannabis Brands
Data for this report comes from real-time sales reporting by participating cannabis retailers via their point-of-sale systems, which are linked up with Headset’s business intelligence software. Headset’s data is very reliable, as it comes digitally direct from our partner retailers. However, the potential does exist for misreporting in the instance of duplicates, incorrectly classified products, inaccurate entry of products into point-of-sale systems, or even simple human error at the point of purchase. Thus, there is a slight margin of error to consider. Brands listed on this page are ranked in the top twenty within the market and product category by total retail sales volume.

