Market Insights Snapshot
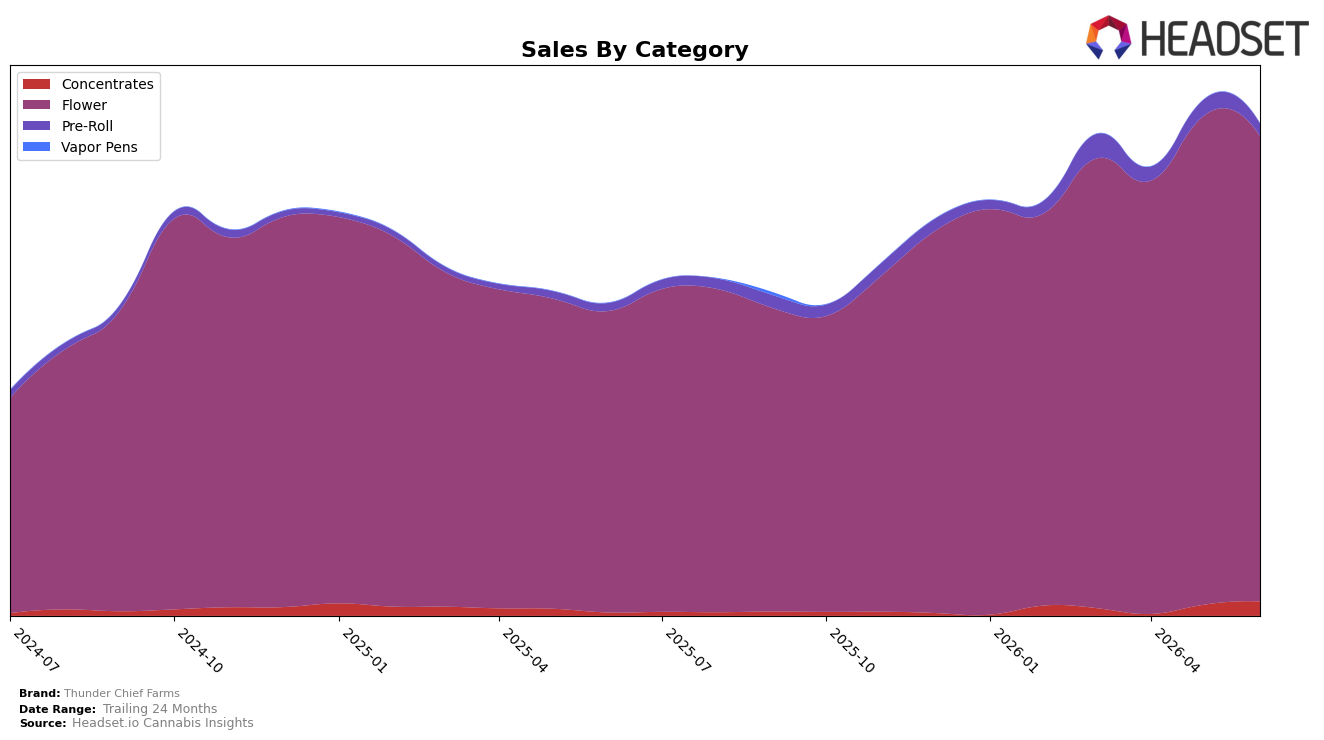
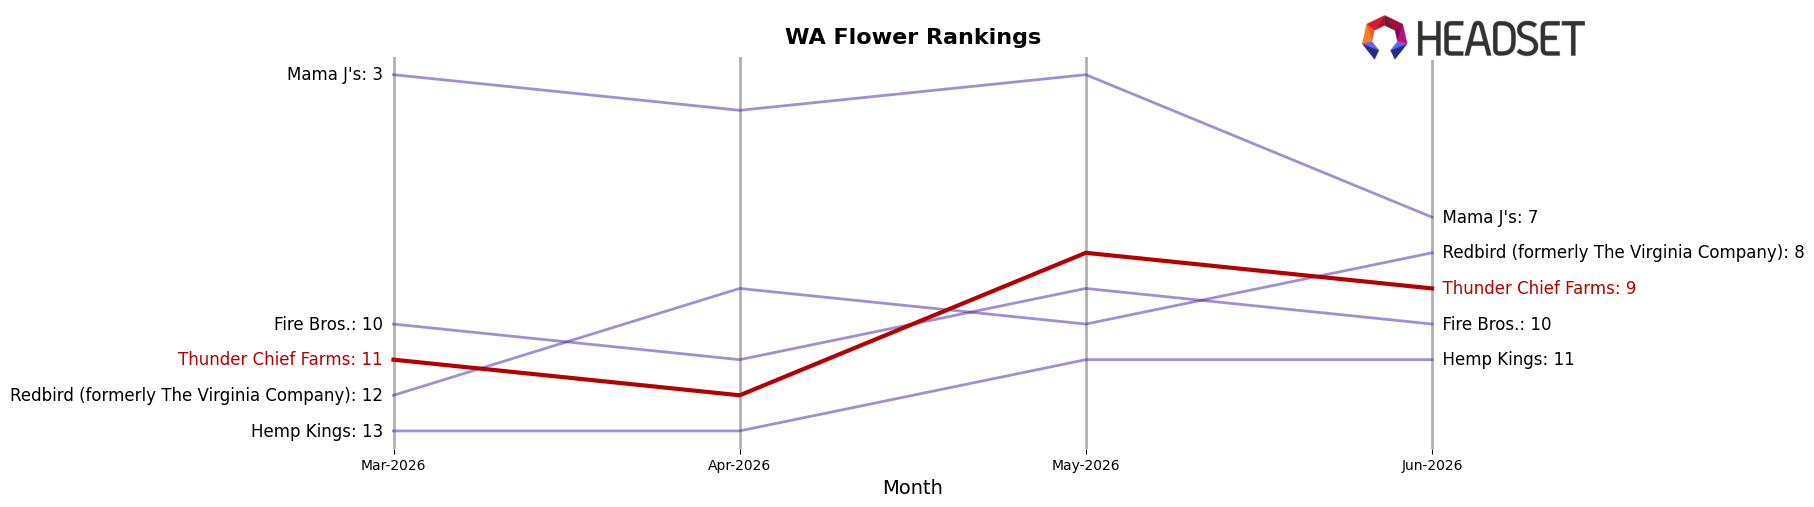
Thunder Chief Farms concentrated 94.67% of June 2026 sales in Flower, where year-over-year sales rose 54.46% even as month-over-month dipped 4.91%, while Pre-Roll held 2.48% share with 59.78% YoY growth but a 23.67% MoM decline; Concentrates expanded to 2.85% share with 373.95% YoY growth and a 29.16% MoM increase. Average price fell 12.39% YoY to $25.37 alongside a Flower average price of 27.41, indicating volume-driven gains; the brand ranked 9 in Flower in Washington, so the pattern implies Thunder Chief Farms is trading lower prices for share defense in its core while using Concentrates growth to offset Pre-Roll volatility.
The mix shift—Flower share at 94.67% paired with a 4.91% MoM contraction, versus Concentrates’ 29.16% MoM lift and 373.95% YoY surge—implies the next increment of growth depends on extending beyond Flower rather than deepening it. With a 9 rank in Washington Flower and a 12.39% YoY price decrease, the brand is positioned as a value-led Flower player; the simultaneous 59.78% YoY gain but 23.67% MoM drop in Pre-Roll suggests promotional or strain-cycle sensitivity, so reallocating emphasis toward steadily compounding Concentrates while stabilizing Pre-Roll could raise overall rank without eroding price further.
Competitive Landscape
Thunder Chief Farms sits at rank #9 in June 2026, up 13 positions from #22 year over year and improving 2 spots from #11 in March 2026, while briefly peaking at #8 in May 2026; by contrast, Phat Panda held #1 both year over year and in June 2026 with a 16.6% YoY sales lift, and Lifted Cannabis Co advanced from #8 YoY rank to #3 with 17.9% YoY sales growth. With Legends steady at #2 despite a -19.8% YoY sales decline and Sweetwater Farms climbing to #5 on a 65.8% YoY surge, Thunder Chief Farms’ May-to-June slip from #8 to #9 alongside a 13-rank YoY rise implies mid-pack momentum that risks being outpaced unless gains convert from transient rank peaks to sustained share capture.
Notable Products
Frosted Flakes (3.5g) posted the standout move in June 2026 with a +102% month-over-month surge to rank 2, while Butter (3.5g) fell -20% yet held rank 1, and Blueberry Ocean (3.5g) declined -38% at rank 6. The steep -49% slide for Cotton Candy (3.5g) at rank 8 contrasts with The Milk Man (3.5g) dropping -19% at rank 5, indicating that volatility is concentrated in mid-tier SKUs rather than the leader. With all top-ten items in Flower and multiple Butter-family variants present, the portfolio is consolidating around a narrow set of Flower-led strains while reallocating demand toward a breakout value anchor, implying a pivot toward fewer hero SKUs that can scale price-volume tradeoffs.
Top Selling Cannabis Brands
Data for this report comes from real-time sales reporting by participating cannabis retailers via their point-of-sale systems, which are linked up with Headset’s business intelligence software. Headset’s data is very reliable, as it comes digitally direct from our partner retailers. However, the potential does exist for misreporting in the instance of duplicates, incorrectly classified products, inaccurate entry of products into point-of-sale systems, or even simple human error at the point of purchase. Thus, there is a slight margin of error to consider. Brands listed on this page are ranked in the top twenty within the market and product category by total retail sales volume.

