Jun-2026
Sales
Trend
6-Month
Product Count
SKUs
Avg Price
YoY Sales Change
YoY Price Change
Market Insights Snapshot
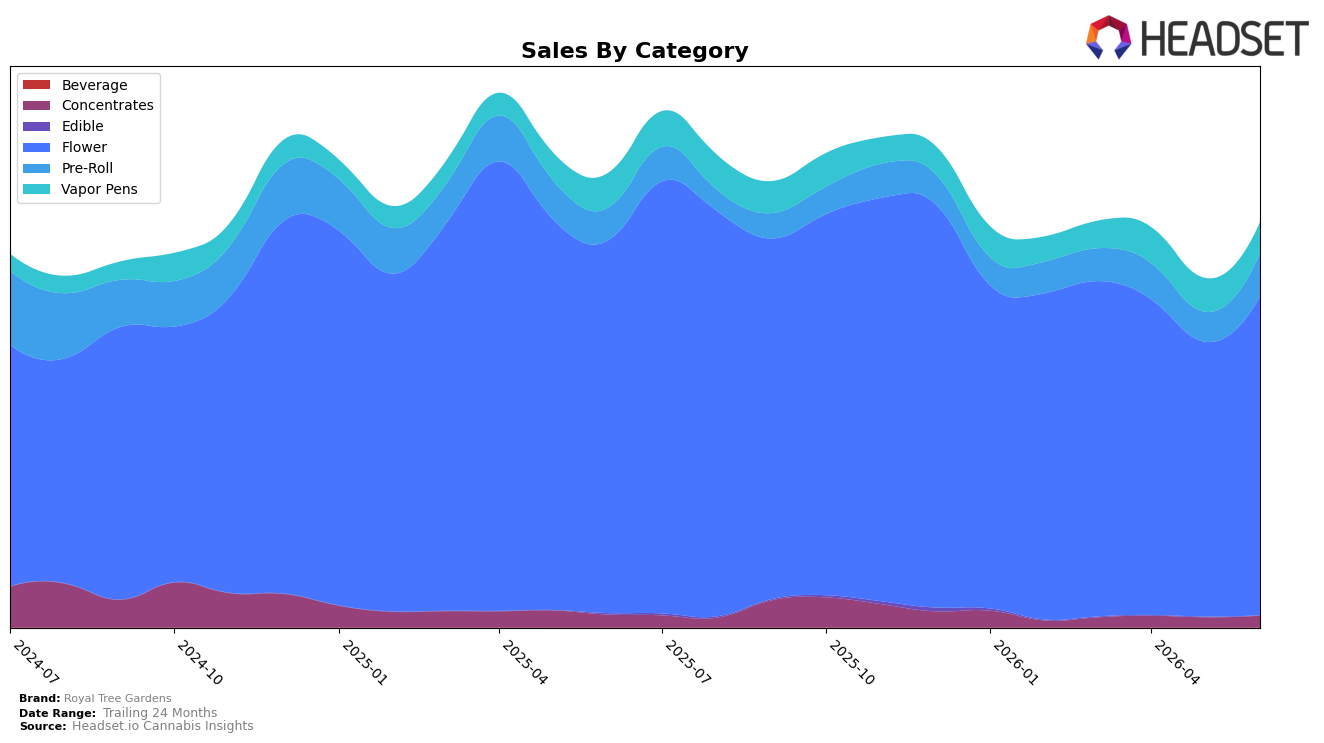
Royal Tree Gardens concentrated 78.996% of June 2026 sales in Flower while Pre-Roll and Vapor Pens held 10.562% and 7.593% share respectively, with Flower down 14.48% year over year but up 16.12% month over month and Pre-Roll up 31.90% year over year and 44.10% month over month. Vapor Pens contracted 10.85% year over year and 8.45% month over month, while Concentrates inched up 16.05% month over month despite an 8.90% year-over-year decline; Edible collapsed 94.34% year over year and 83.37% month over month to a 0.014% share. With the brand’s overall sales down 10.92% year over year alongside an 11.71% drop in average price to $18.20, the mix is pivoting toward volume-led gains in Flower and Pre-Roll that partially offset unit pressure in Vapor Pens and the exit-level contraction in Edible, implying a reliance on value-forward inhalables to stabilize near-term momentum.
Holding rank 17 in Flower in Washington while Flower’s 16.12% month-over-month lift outpaced Vapor Pens’ 8.45% month-over-month decline positions the brand to lean into its core where share is defensible. The 31.90% year-over-year and 44.10% month-over-month expansion in Pre-Roll, paired with Flower’s 78.996% share, indicates a barbell across budget-friendly units and flagship eighths, while the 11.71% year-over-year price decrease suggests price-pack architecture as the primary lever; the implication is to consolidate around Flower and Pre-Roll to reinforce rank in Washington while pruning underperforming Vapor Pens and Edible where double-digit declines weaken contribution.
Competitive Landscape
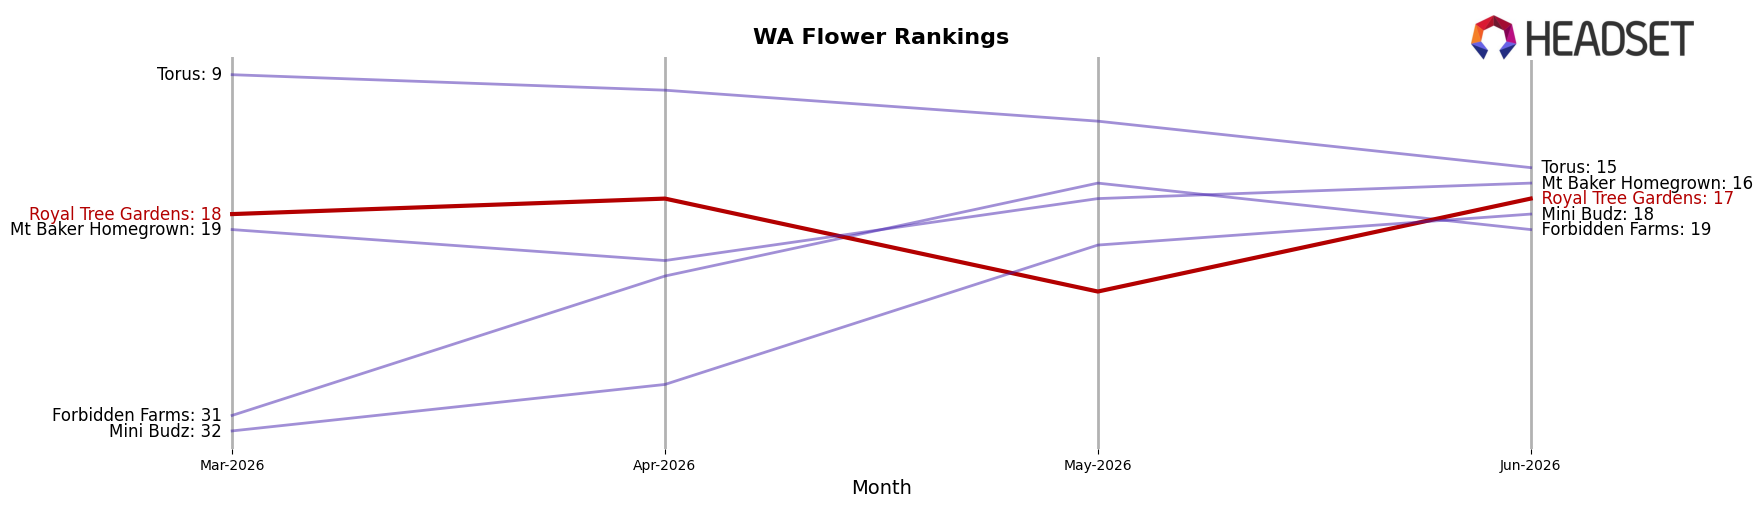
Royal Tree Gardens sits at rank #17 in WA Flower for June 2026, down 1 position year over year from #16 and up 1 position versus March 2026’s #18, while its peak of #11 in July 2025 marks a 6-rank slide from last summer; against this backdrop, Phat Panda held #1 year over year with +16.6% sales growth and Lifted Cannabis Co advanced from #8 to #3 alongside +17.9% sales growth, indicating Royal Tree Gardens is losing relative position as faster-rising leaders consolidate share even as mid-term rank drift is flat-to-slightly improving.
Notable Products
Astronaut Status (3.5g) posted the largest month-over-month surge at +54.4%, vaulting into rank 5 while Middlefork (3.5g) rose +47.5% to secure rank 1. In contrast, Tropicanna Cherry (3.5g) fell -37.1% to rank 6, creating a wide spread between ascending and retreating SKUs. With all ten top sellers in Flower and the top three ranks held by Flower eighths, the mix concentrates demand in a single format, implying Royal Tree Gardens is leaning into a few fast-moving strains rather than diversifying formats to hedge volatility.
Top Selling Cannabis Brands
Data for this report comes from real-time sales reporting by participating cannabis retailers via their point-of-sale systems, which are linked up with Headset’s business intelligence software. Headset’s data is very reliable, as it comes digitally direct from our partner retailers. However, the potential does exist for misreporting in the instance of duplicates, incorrectly classified products, inaccurate entry of products into point-of-sale systems, or even simple human error at the point of purchase. Thus, there is a slight margin of error to consider. Brands listed on this page are ranked in the top twenty within the market and product category by total retail sales volume.

