Jun-2026
Sales
Trend
6-Month
Product Count
SKUs
Avg Price
YoY Sales Change
YoY Price Change
Market Insights Snapshot
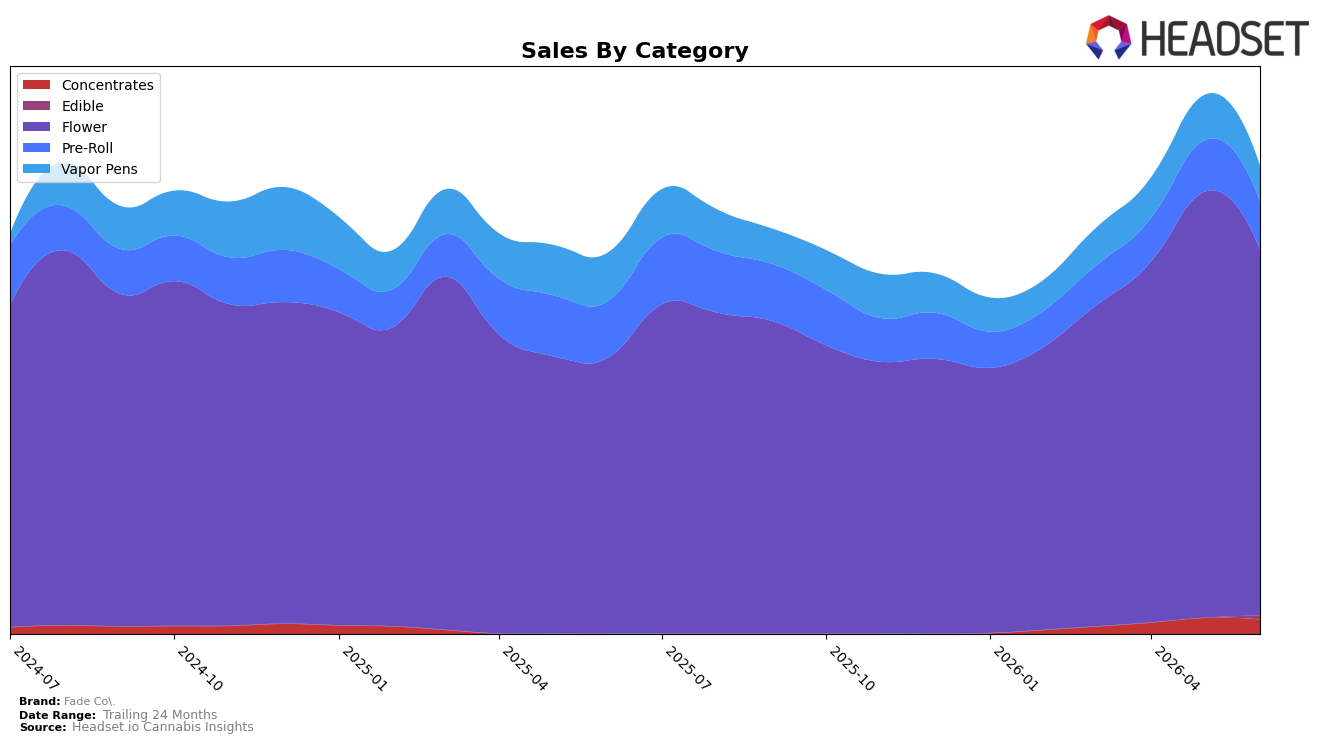
In June 2026, Fade Co.’s mix leaned heavily into Flower at 78.30% share with year-over-year growth of 32.66% but a month-over-month decline of 14.08%, while Pre-Roll held 10.31% share with a -14.56% YoY change and a -5.87% MoM change. Vapor Pens represented 7.56% share with a -26.79% YoY contraction and a -21.81% MoM drop, and Concentrates at 3.09% share fell -8.93% MoM while Edible sat at 0.74% share with no comparable percentages available; this concentration aligns with a category leadership position as Flower ranked 3 in Maryland, implying the brand’s aggregate 22.83% YoY sales growth is being driven by a single anchor category despite sequential pullback.
The shift — rising Flower weight paired with double-digit MoM declines in Flower (-14.08%) and Vapor Pens (-21.81%) — implies near-term exposure to category cyclicality and less diversification, even as brand average price rose 16.72% YoY to $31.92. With Pre-Roll contracting -14.56% YoY and Concentrates down -8.93% MoM, the current mix suggests pricing power and rank in Flower can sustain share in the short run, but the pattern points to a need for mix balance to reduce volatility if Vapor Pens continue at -26.79% YoY while Flower remains the top-3 anchor in Maryland.
Competitive Landscape
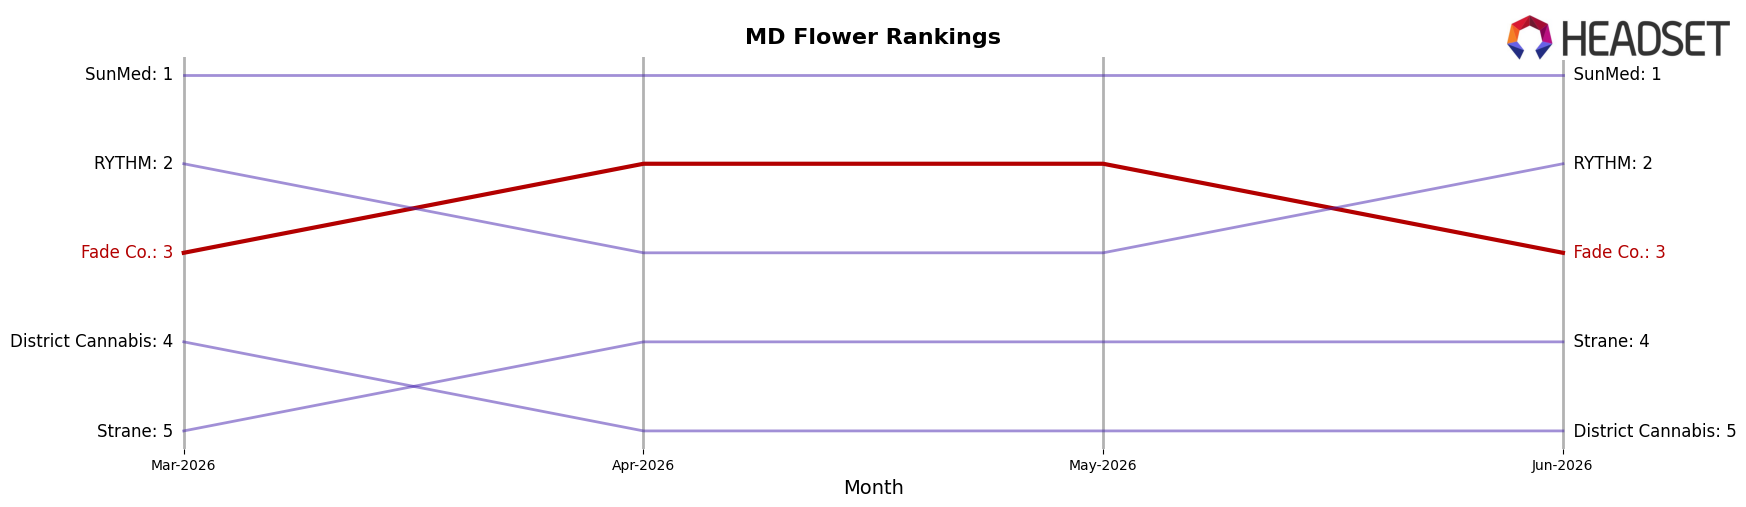
Fade Co. sits at rank #3 in MD Flower with a YoY rank decline of 1 position from #2, and it has held #3 for three months while being off its peak of #1 from December 2024; meanwhile, SunMed held #1 YoY and remains #1 with sales up 13.4%, and RYTHM climbed from #3 YoY to #2 with sales up 42.7%, creating upward pressure just above Fade Co.; additionally, Strane moved from #7 YoY to #4 with sales up 58.8%, and District Cannabis held #5 YoY while growing 14.9%, indicating faster-moving rivals surrounding Fade Co.; the pattern implies that without share-accretive moves, the flat three-month position at #3 amid upward moves by RYTHM and Strane increases the risk of Fade Co. drifting further from its December 2024 peak.
Notable Products
Matanuska Thunder F (3.5g) posted the steepest movement in June 2026 with a -35.1% month-over-month drop and slid to rank 7, while Mule Fuel (3.5g) also contracted -29.9% and held rank 4. In contrast, Super Boof (3.5g) stayed at rank 1 despite a -16.9% decline, and E85 Candi A (3.5g) fell -13.3% at rank 10. With eight of the top ten in the Flower category and Super Boof (3.5g) still leading on $276,079 in sales, the pattern implies reliance on flagship Flower SKUs amid broad Flower softness, suggesting portfolio risk concentrated in a single category.
Top Selling Cannabis Brands
Data for this report comes from real-time sales reporting by participating cannabis retailers via their point-of-sale systems, which are linked up with Headset’s business intelligence software. Headset’s data is very reliable, as it comes digitally direct from our partner retailers. However, the potential does exist for misreporting in the instance of duplicates, incorrectly classified products, inaccurate entry of products into point-of-sale systems, or even simple human error at the point of purchase. Thus, there is a slight margin of error to consider. Brands listed on this page are ranked in the top twenty within the market and product category by total retail sales volume.

