Jun-2026
Sales
Trend
6-Month
Product Count
SKUs
Avg Price
YoY Sales Change
YoY Price Change
Market Insights Snapshot
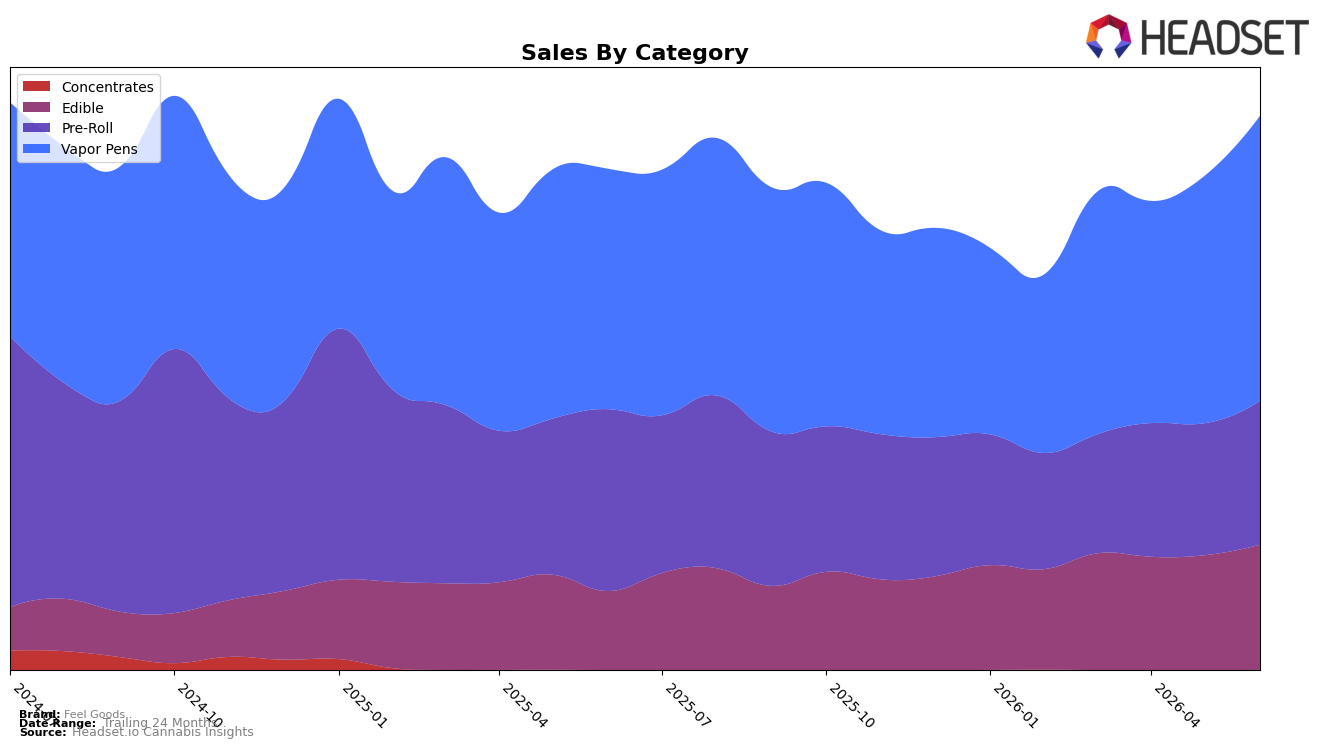
In June 2026, Vapor Pens accounted for 51.43% share with 18.49% YoY growth and 15.13% MoM, while Pre-Roll held 25.98% share but declined 20.80% YoY despite a 9.12% MoM uptick; Edible reached 22.60% share with 58.73% YoY growth and 9.17% MoM. Brand-wide, sales were up 10.57% YoY while average price fell 11.23% YoY, indicating mix-driven volume gains concentrated in Vapor Pens and Edible. With Vapor Pens ranked 19th in Oregon, the category mix suggests the portfolio is leaning into higher-velocity formats where rank can be defended through price-accessible offerings.
The pivot toward Vapor Pens (+18.49% YoY) and Edible (+58.73% YoY), combined with a 11.23% YoY price decrease, implies a value-led positioning that trades price for share, while Pre-Roll’s 20.80% YoY decline alongside a 9.12% MoM rebound points to episodic promo sensitivity rather than sustained traction. Holding 51.43% of sales in Vapor Pens yet at rank 19 in Oregon indicates room to ladder mix toward faster-moving sub-SKUs to climb ranks, and the 22.60% Edible share with 9.17% MoM growth signals a secondary growth pillar that can buffer volatility from the 25.98% Pre-Roll slice.
Competitive Landscape
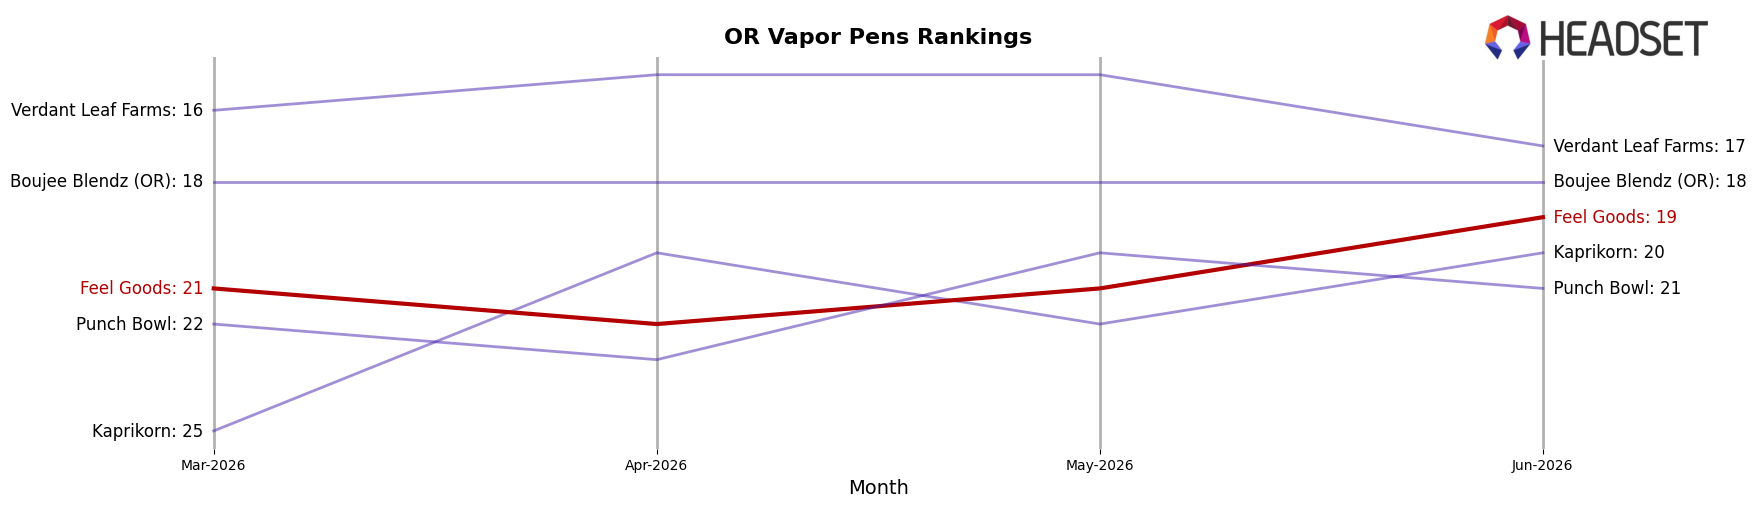
Feel Goods is ranked #19 in OR Vapor Pens in June 2026, improving 1 position YoY from #20 and ticking up 2 positions versus March 2026 from #21, marking a new peak rank at #19 in June 2026 while still 18 places behind category leader Buddies at #1, which rose from #2 YoY, and 17 places behind FRESHY at #2, which climbed from #5 YoY by 3 ranks more than Feel Goods; meanwhile, Entourage Cannabis / CBDiscovery slid from #1 to #3 as its sales fell 38.85%, contrasting with Oregrown moving from #11 to #5 on 57.40% sales growth, implying that Feel Goods’ modest 1-rank YoY ascent amid faster-moving rivals positions it for incremental share wins rather than leapfrog gains without a step-change in velocity.
Notable Products
With no product posting a month-over-month gain above 50% or a decline steeper than -10%, the notable movement is Jammin Blueberry Infused Pre-Roll 5-Pack (3.75g) jumping 40% to rank 6 while Citrus Twist Infused Pre-Roll 5-Pack (3.75g) slipped -8% to rank 8, indicating a rotation within Pre-Rolls rather than category expansion. Blueberry Straw Gummy (100mg) held rank 1 despite a -3% dip, while Watermelon Straw Gummy (100mg) advanced 16% at rank 3 and Strawberry Straw Gummy (100mg) climbed 24% at rank 5, pointing to momentum concentrated in mid-pack Edibles. Five of the top seven are Edible SKUs, yet the single largest dollar contributor was a Pre-Roll at $56,170, implying baskets are still anchored by Edibles for velocity while Pre-Rolls provide ticket-size lift. The mix suggests Feel Goods is consolidating share through breadth in Edibles while selectively scaling higher-value Pre-Rolls for revenue leverage.
Top Selling Cannabis Brands
Data for this report comes from real-time sales reporting by participating cannabis retailers via their point-of-sale systems, which are linked up with Headset’s business intelligence software. Headset’s data is very reliable, as it comes digitally direct from our partner retailers. However, the potential does exist for misreporting in the instance of duplicates, incorrectly classified products, inaccurate entry of products into point-of-sale systems, or even simple human error at the point of purchase. Thus, there is a slight margin of error to consider. Brands listed on this page are ranked in the top twenty within the market and product category by total retail sales volume.

