Market Insights Snapshot
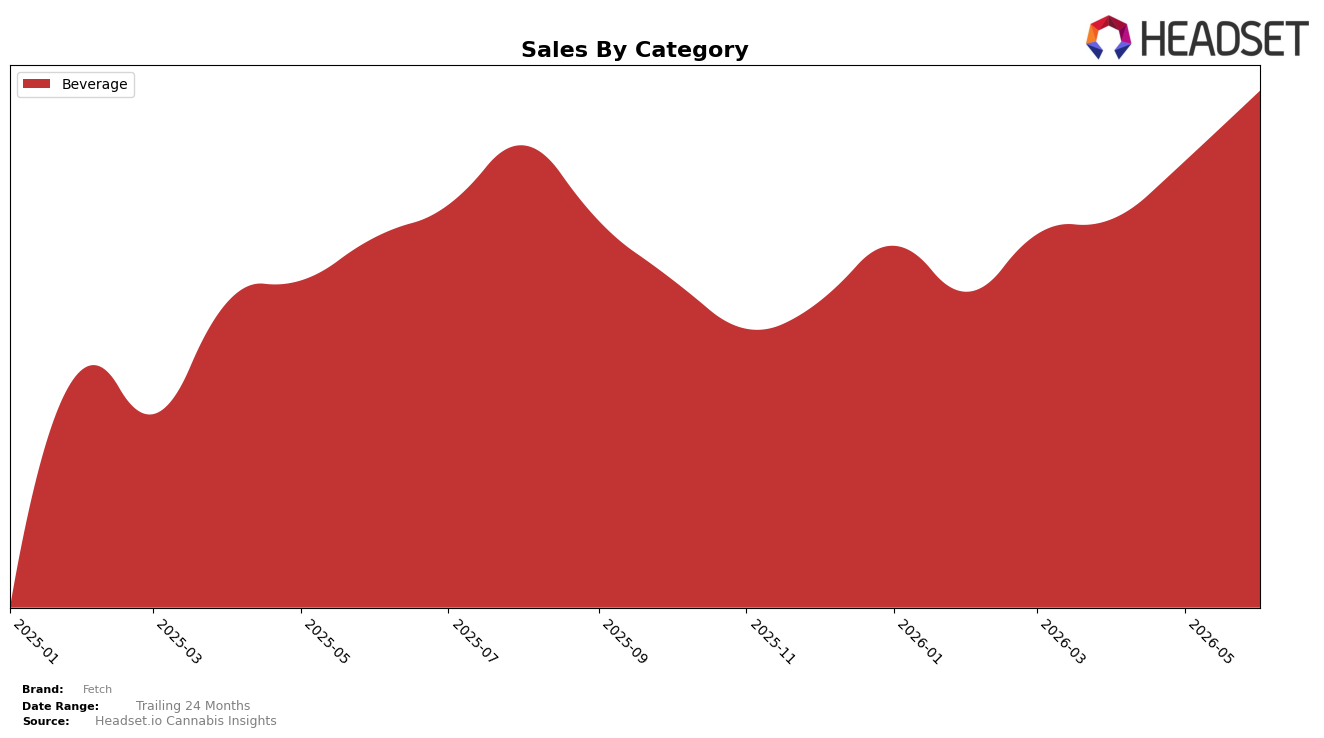
Fetch concentrated 100.0% of June 2026 sales in Beverage, with year-over-year growth of 37.8% and month-over-month growth of 15.2%, while average price rose 2.7% to $6.57. Within Alberta Beverage, Fetch held rank 10, implying mid-pack placement rather than category tail or leader. The pattern implies Fetch is leaning into a single-category bet where volume growth outpaces pricing, so the brand’s trajectory depends on sustaining Beverage velocity rather than multi-category diversification.
Being rank 10 in Alberta Beverage alongside 37.8% YoY and 15.2% MoM suggests share gains are volume-led at current price elasticity, not premium-led, as only a 2.7% price lift accompanied double-digit unit momentum. This positioning implies an accessible-price Beverage play that can climb from rank 10 if distribution and repeat continue compounding faster than price, but it also signals concentration risk if Beverage growth cools relative to broader categories.
Competitive Landscape
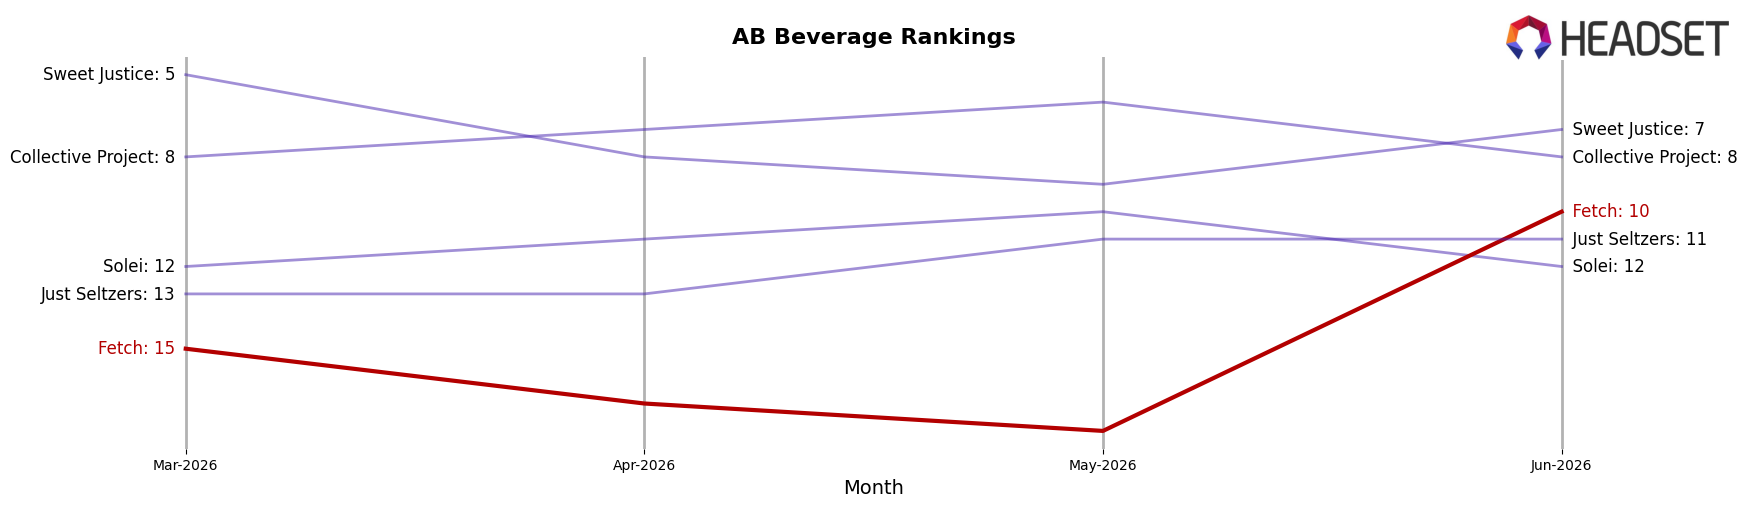
Fetch is currently ranked #10 in AB Beverage in June 2026, improving 9 positions from #19 year over year, and also rising 5 spots from #15 since March 2026; this coincides with a peak rank of #10 reached in June 2026 and places it 9 positions behind the category leader. While XMG held at #1 year over year and remains #1 despite a -18.9% sales change, Mary Jones advanced from #4 to #2 alongside a 177.5% sales increase, indicating Fetch’s 9-rank YoY climb is occurring amid both contraction at the top and aggressive gains just below the leader; the pattern implies Fetch’s trajectory is upward but will require continued share capture to sustain movement past the #10–#5 corridor where competitors are accelerating.
Notable Products
Classic Cola Zero (10mg THC, 355ml) led June 2026 with a +17.7% month-over-month increase while holding rank 1, and Cream Soda (10mg THC, 355ml) added +7.6% at rank 2. Lemon Lime Zero Soda (10mg THC, 355ml) slipped -3.5% while remaining at rank 3, putting the largest momentum gap between rank positions 1 and 3. With all three top-10 SKUs concentrated in Beverage, the mix points to Fetch prioritizing a flagship cola-driven lineup supported by adjacent flavors to consolidate share at the top of the rankings.
Top Selling Cannabis Brands
Data for this report comes from real-time sales reporting by participating cannabis retailers via their point-of-sale systems, which are linked up with Headset’s business intelligence software. Headset’s data is very reliable, as it comes digitally direct from our partner retailers. However, the potential does exist for misreporting in the instance of duplicates, incorrectly classified products, inaccurate entry of products into point-of-sale systems, or even simple human error at the point of purchase. Thus, there is a slight margin of error to consider. Brands listed on this page are ranked in the top twenty within the market and product category by total retail sales volume.

