.svg)

Sep-2026
Sales
Trend
6-Month
Product Count
SKUs
Avg Price
YoY Sales Change
YoY Price Change




Where to Buy
Find. is stocked at 777 licensed dispensaries across New York, New Jersey, and 11 other states, 209 of them in New York, with the deepest coverage in New York, Brooklyn, Queens, Staten Island, and The Bronx. Search by ZIP code or city below to find the closest one, or filter by product type if you are after a specific format.
Market Insights Snapshot
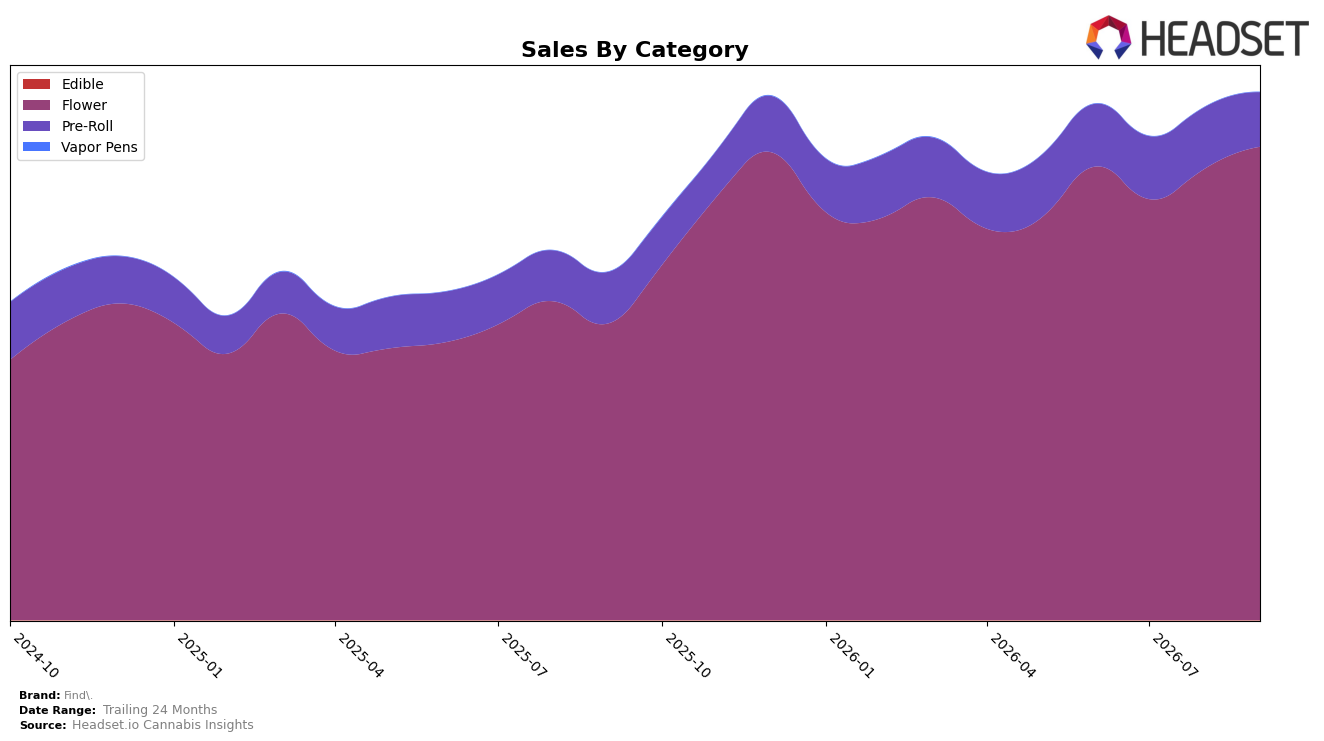
Find.’s category mix in September 2026 skewed heavily to Flower at 89.71% share, with Flower sales up 59.64% year over year and 4.89% month over month, while Pre-Roll held 10.27% share with 5.94% YoY growth but an 11.68% MoM decline. Vapor Pens remained a rounding error at 0.01% share despite a 37.64% MoM lift and 17.36% YoY increase, and the brand’s average price rose 5.14% YoY to $30.97. With Flower ranked 1 in New Jersey and brand-level sales up 51.73% YoY, the pattern implies concentration risk alongside price elasticity headroom concentrated in Flower.
The shift—Flower mix expanding on a 59.64% YoY and 4.89% MoM rise while Pre-Roll contracts 11.68% MoM at only 10.27% share—positions Find. as a Flower-first player trading depth for breadth, with Vapor Pens’ 37.64% MoM but 0.01% share signaling test-level presence rather than a scaling pillar. Holding a number 1 Flower rank in New Jersey and growing brand sales 51.73% YoY suggests near-term gains will continue to be driven by Flower price and velocity rather than portfolio diversification, implying that resilience to category volatility will depend on maintaining Flower’s price architecture while selectively rebuilding Pre-Roll mix.
Competitive Landscape
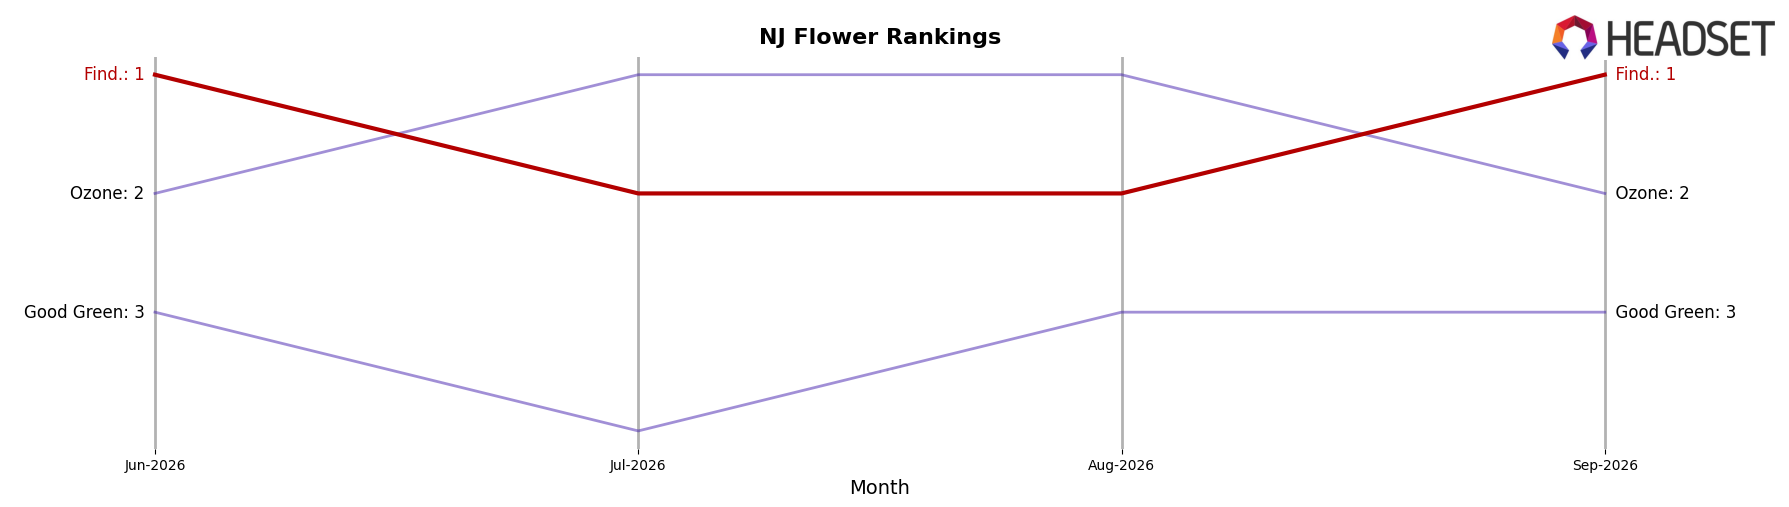
Find. sits at rank #1 in NJ Flower in September 2026, a climb of 5 positions year over year from #6, and it has held #1 over the past three months, indicating both a peak rank of #1 in September 2026 and a sustained top position. Against this, Ozone holds at #2 with a -2.8% YoY sales change while Find. advanced 5 ranks YoY, and Good Green rose from #17 to #3 with +166.7% YoY sales yet remains two positions behind Find.; meanwhile, RYTHM slipped from #3 to #4 alongside a -9.8% YoY sales change compared with Find.’s upward rank delta. The pattern implies Find.’s rank trajectory is driven more by relative outperformance than category lift, as competitors either improved from much lower bases or ceded share while Find. converted a 5-rank YoY gain into sustained leadership.
Notable Products
B.A.M. Pre-Roll (1g) posted the sharpest movement in September 2026 with a -8.0% month-over-month decline at rank 8, while Lemon Creamsicle Pre-Roll (1g) rose +25.8% to rank 2, signaling a split in Pre-Roll momentum inside the top 10. Two Flower SKUs sit in the top 4—Baya Dulce (14g) at rank 1 and Animal Mintz Cake (14g) at rank 4—while four of the top ten are Pre-Roll SKUs, indicating a portfolio anchored by Flower for rank but diversified by Pre-Rolls for velocity. The concentration suggests Find. is leaning on high-rank Flower to secure share while using selective Pre-Roll gains to drive incremental trial and ladder consumers into larger format Flower.
Top Selling Cannabis Brands






Data for this report comes from real-time sales reporting by participating cannabis retailers via their point-of-sale systems, which are linked up with Headset’s business intelligence software. Headset’s data is very reliable, as it comes digitally direct from our partner retailers. However, the potential does exist for misreporting in the instance of duplicates, incorrectly classified products, inaccurate entry of products into point-of-sale systems, or even simple human error at the point of purchase. Thus, there is a slight margin of error to consider. Brands listed on this page are ranked in the top twenty within the market and product category by total retail sales volume.

