May-2026
Sales
Trend
6-Month
Product Count
SKUs
Avg Price
YoY Sales Change
YoY Price Change
Market Insights Snapshot
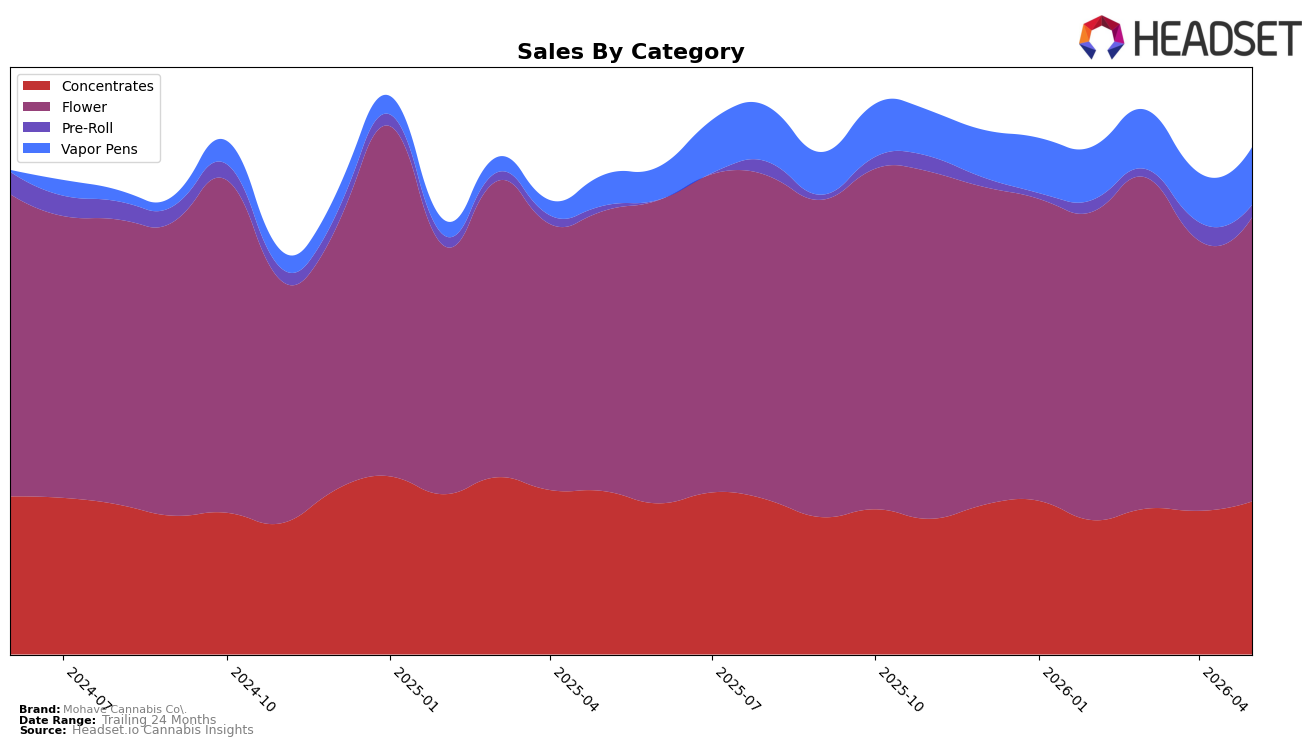
In May 2026, Mohave Cannabis Co. concentrated 55.15% of sales in Flower with a 1.39% YoY increase and a 5.00% MoM lift, while Concentrates held 30.03% share with a -6.22% YoY decline but a 6.34% MoM rise. Vapor Pens expanded to 11.75% share on 78.31% YoY and 15.76% MoM growth, whereas Pre-Roll remained a small 3.07% share with 81.26% YoY growth but a -27.32% MoM drop. With the brand’s average price down 7.25% YoY alongside a modest 5.59% YoY sales gain, the mix shift toward Vapor Pens and steady Flower suggests volume is being supported by lower price points and by categories with faster unit velocity, and the -15.77% 24-month trend implies the current growth is more mix- than market-expansion driven within Arizona.
The combination of a 3rd-place Flower rank in Arizona and a 5.00% MoM Flower uptick positions Mohave Cannabis Co. to use Flower as the baseline while Vapor Pens’ 15.76% MoM acceleration provides incremental reach; in contrast, Concentrates’ -6.22% YoY signals a softening core that still contributes scale at 30.03% share. The divergence between Pre-Roll’s -27.32% MoM and 81.26% YoY indicates episodic gains rather than durable traction, while the 7.25% YoY price decline paired with 78.31% YoY growth in Vapor Pens implies a value-led entry strategy that widens the addressable base without diluting Flower’s 55.15% anchor. Net effect: the brand’s near-term positioning leans on maintaining top-three Flower credibility while capturing incremental unit growth via lower-priced, faster-growing Vapor Pens to offset Concentrates softness.
Competitive Landscape
Mohave Cannabis Co. sits at rank #3 in AZ Flower for May 2026, unchanged YoY from rank #3, after slipping 1 position from #2 in March 2026, implying pressure in the top tier despite stability over twelve months. Against this, JustFLOWR (MA) held #1 both YoY and in May 2026 even while posting a -37.4% YoY sales change, and Find. remained #2 with a -25.3% YoY sales change, so Mohave Cannabis Co.’s flat rank alongside higher-ranked competitors with double-digit declines signals relative share defense; meanwhile Just Flower / Just Vape surged from #51 YoY to #4 with +2749.9% YoY growth and Brown Bag advanced to #5 from #14 YoY with +142.9% growth, indicating intensifying chase from below. The pattern implies Mohave Cannabis Co.’s rank trajectory is plateauing at #3 while volatility above and acceleration below raise the risk of compressed headroom unless the brand converts its Q1 peak at #2 into sustained share gains.

Notable Products
Select - Pre 98 Chem (3.5g) posted the standout movement with a +59.3% month-over-month surge, rising to rank 1, while Super Boof Budder (1g) and Gold - Cherriez Budder (1g) delivered steadier gains of +10.2% at rank 5 and +11.5% at rank 8, respectively. With Flower occupying 7 of the top 10 ranks including positions 1 through 4 and 6, the assortment is tilting toward inhalable value drivers rather than niche extracts. Midnight Monsoon (3.5g) and Hawaiian Nights (3.5g) secured ranks 2 and 3 without published MoM figures, indicating that recent momentum is anchored by Flower depth more than incremental pricing, despite one SKU cresting above $99,000 in May 2026. The pattern implies Mohave Cannabis Co. is consolidating share by prioritizing high-velocity Flower while using a smaller set of Concentrates as margin support rather than primary growth levers.
Top Selling Cannabis Brands
Data for this report comes from real-time sales reporting by participating cannabis retailers via their point-of-sale systems, which are linked up with Headset’s business intelligence software. Headset’s data is very reliable, as it comes digitally direct from our partner retailers. However, the potential does exist for misreporting in the instance of duplicates, incorrectly classified products, inaccurate entry of products into point-of-sale systems, or even simple human error at the point of purchase. Thus, there is a slight margin of error to consider. Brands listed on this page are ranked in the top twenty within the market and product category by total retail sales volume.

