Market Insights Snapshot
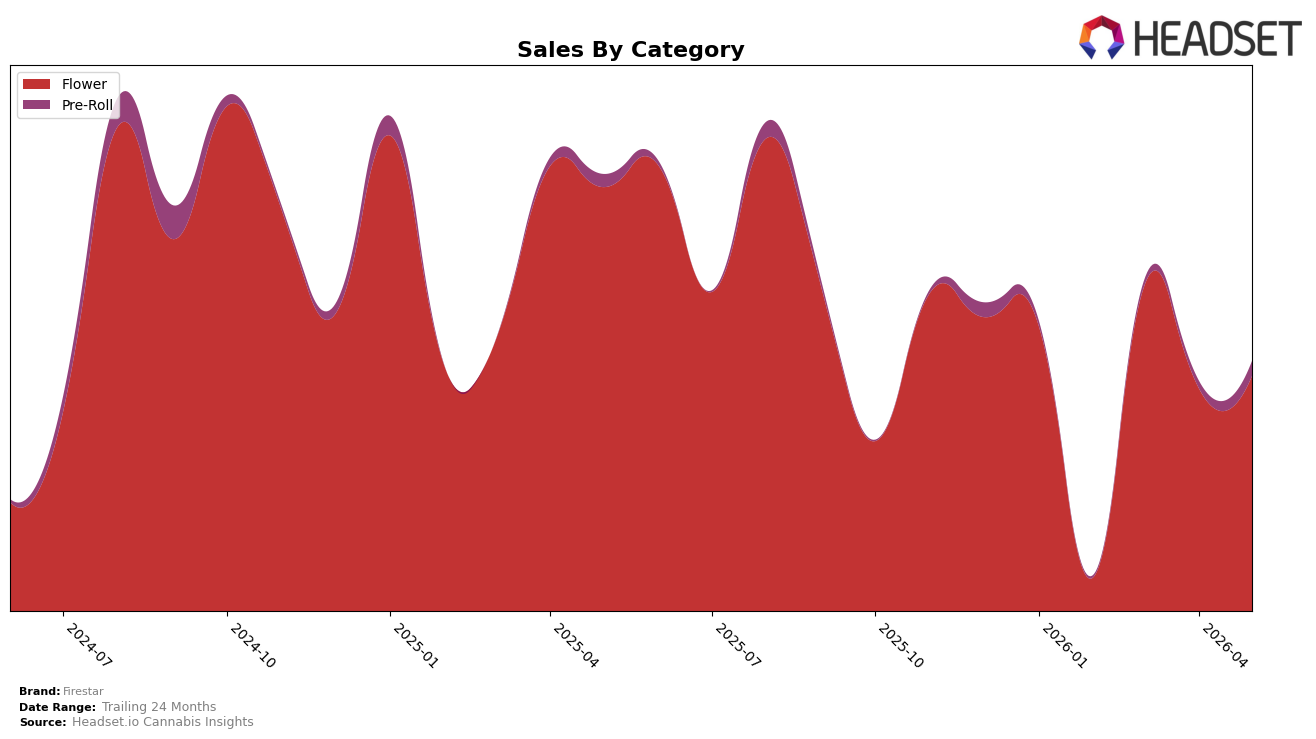
Firestar concentrated 94.13% of May 2026 sales in Flower, with Pre-Roll at 5.87%, while Flower declined 44.57% year over year and rose 5.40% month over month, and Pre-Roll grew 15.40% year over year and 101.66% month over month. Average price increased 1.16% year over year to $32.98, with Flower priced at 37.53 and Pre-Roll at 11.20, and Firestar held rank 21 in Flower in Nevada; this mix indicates a heavy reliance on a shrinking core alongside a rapidly rebounding ancillary format.
The surge in Pre-Roll share momentum against a 44.57% Flower contraction and a 5.40% Flower month-over-month lift suggests Firestar is offsetting core-category drag with a lower-priced entry point as average price edged up 1.16% year over year. With 94.13% of volume still tied to Flower and rank 21 in Nevada Flower, the pattern implies Firestar’s near-term positioning hinges on converting May 2026’s 101.66% Pre-Roll month-over-month growth into sustained mix diversification while stabilizing the Flower base.
Competitive Landscape
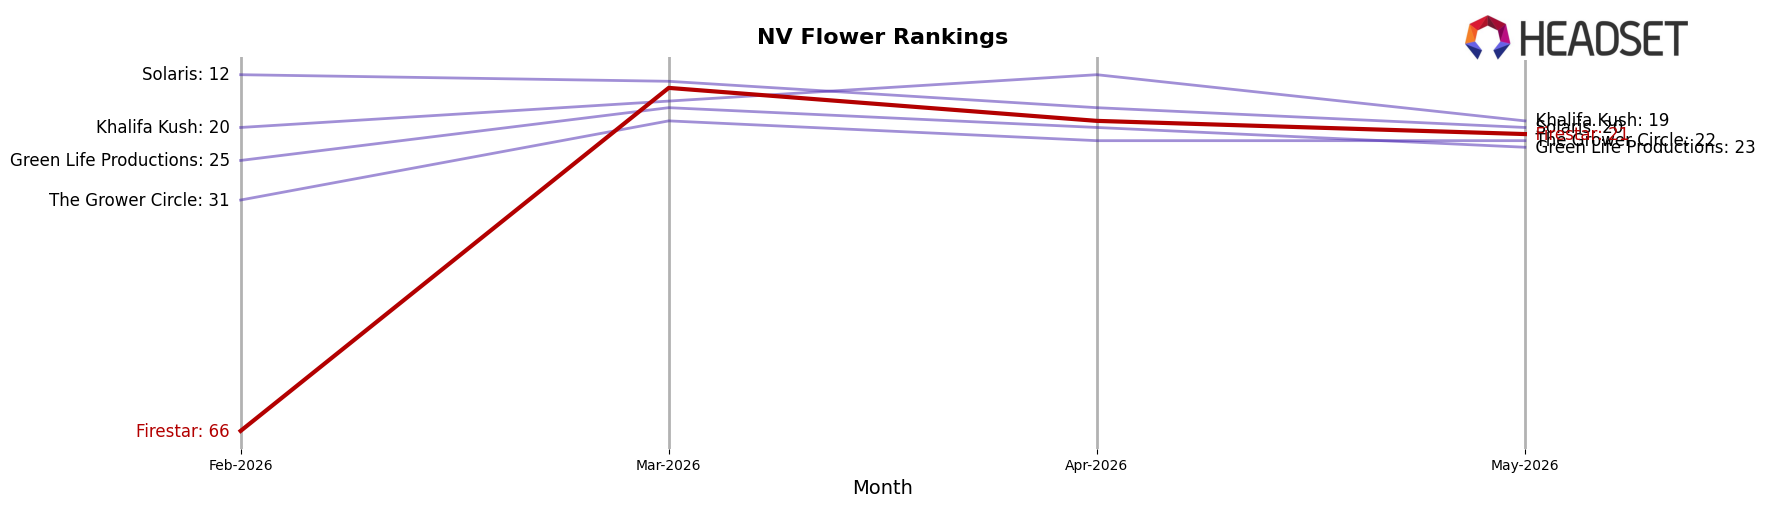
Firestar sits at rank #21 in NV Flower for May 2026, down 10 positions year over year from #11, while rebounding 45 spots since February 2026 when it was #66; this places it well below its peak of #8 reached in June 2025 but well above that three-month trough, indicating volatility rather than linear decline. In contrast, STIIIZY holds #1 with a year-over-year hold at #1 despite a 2.3% sales contraction, and Redwood rose from #54 to #5 alongside a 917.6% year-over-year sales increase, suggesting that share is consolidating toward a few movers while mid-tier brands like Firestar lose rank even as near-term momentum improves. The pattern implies Firestar’s trajectory is one of recovery from early-2026 weakness but not yet a return to 2025 competitiveness, meaning the brand must convert short-term climb into sustained share gains against top-5 risers.
Notable Products
Whoa Si Whoa (14g) posted the steepest movement in May 2026 with a -8.1% month-over-month change while holding rank 5, suggesting price sensitivity or shelf pressure at mid-table positions. Lemon Essence Pre-Roll (1g) rose 13.9% MoM to rank 2, contrasting with Honey Badger Pre-Roll (1g) at rank 1 with no reported MoM figure, which implies the pre-roll tier is consolidating at the very top even as growth is uneven. Four of the top ten are Flower SKUs ranked 3, 4, 5, and 6, and three more Flower items sit at ranks 7, 9, and 10, concentrating seven of the top ten in Flower even though only one product showed a quantified decline; this skew implies Firestar is leaning into larger-pack Flower volume over single-gram formats, with pre-rolls serving as traffic leaders rather than revenue drivers despite Honey Badger’s $6,540 in sales.
Top Selling Cannabis Brands
Data for this report comes from real-time sales reporting by participating cannabis retailers via their point-of-sale systems, which are linked up with Headset’s business intelligence software. Headset’s data is very reliable, as it comes digitally direct from our partner retailers. However, the potential does exist for misreporting in the instance of duplicates, incorrectly classified products, inaccurate entry of products into point-of-sale systems, or even simple human error at the point of purchase. Thus, there is a slight margin of error to consider. Brands listed on this page are ranked in the top twenty within the market and product category by total retail sales volume.

