.svg)

Sep-2026
Sales
Trend
6-Month
Product Count
SKUs
Avg Price
YoY Sales Change
YoY Price Change


Where to Buy
Summa Cannabis is stocked at 16 licensed dispensaries across Nevada, with the deepest coverage in Las Vegas, Henderson, North Las Vegas, Reno, and Schurz. Search by ZIP code or city below to find the closest one, or filter by product type if you are after a specific format.
Market Insights Snapshot
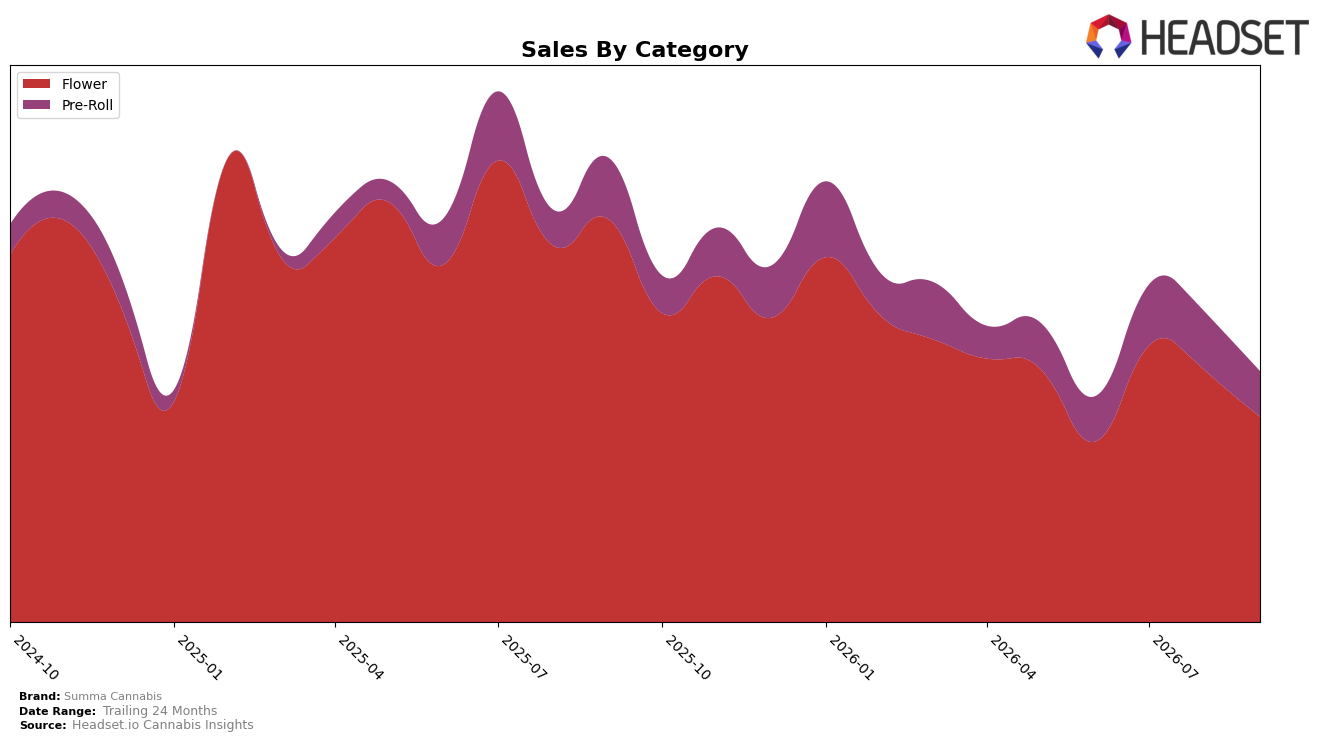
In September 2026, Summa Cannabis concentrated 78.48% of sales in Flower, down 17.48% month over month and 47.34% year over year, while Pre-Roll accounted for 21.52% of sales with a 17.58% MoM decline and a 20.84% YoY drop; the overall brand average price fell 17.72% YoY even as Flower’s category-specific average price sat at $22.82. With brand sales down 43.25% YoY and a 24-month change of -28.92%, the mix tilt toward Flower during simultaneous double-digit MoM declines in both categories implies overexposure to a contracting core segment and insufficient offset from Pre-Roll despite its smaller YoY contraction.
Holding rank 21 in Flower in Nevada alongside a 78.48% category reliance and a 17.48% MoM volume pullback suggests position risk if mix isn’t rebalanced toward comparatively less-declining Pre-Roll, which fell 20.84% YoY versus Flower’s 47.34% YoY. The 17.72% YoY price decrease combined with parallel MoM drops in both categories indicates pricing moves are not translating into share defense within Flower, so the current configuration likely compresses visibility in rankings unless September 2026 assortment shifts redistribute at least several share points from Flower to Pre-Roll.
Competitive Landscape
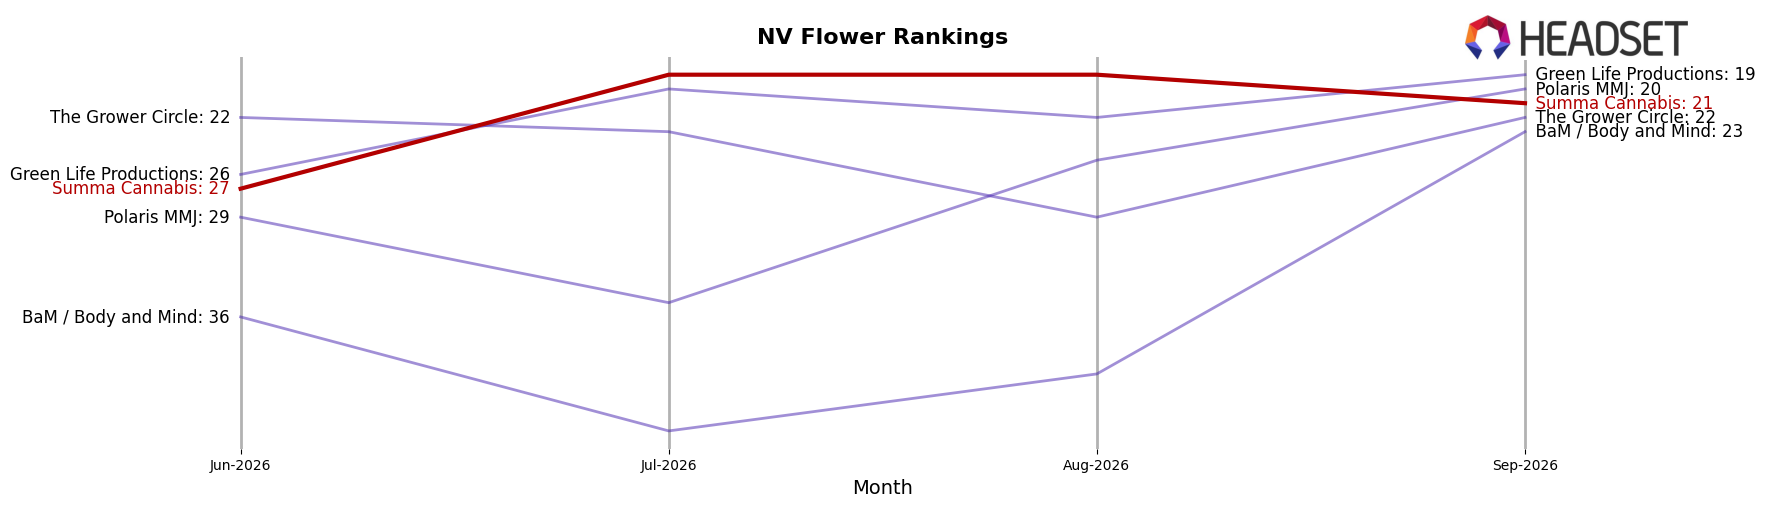
Summa Cannabis sits at rank #21 in NV Flower for September 2026, down 8 positions year over year from #13 and up 6 positions versus June 2026’s #27, while its historical peak was #11 in February 2025; this mix of a 38.5% YoY rank drop in the top-20 vicinity and a 22.2% quarter-over-quarter rank recovery signals volatility rather than linear decline. In contrast, RYTHM held #1 year over year with a 19.7% sales increase, and Neon Moon advanced from #9 to #4 alongside an 82.7% YoY sales gain, indicating that leaders are consolidating share while fast risers compress mid-tier slots; given this backdrop, Summa Cannabis’s rebound from #27 to #21 but slippage from #13 YoY implies the brand is stabilizing in the lower-20s unless it converts short-term gains into sustained share capture.
Notable Products
Peak 112 Pre-Roll (1g) posted the steepest move in September 2026 with a -57.6% month-over-month decline while dropping to rank 4, contrasting with Shake Shack Pre-Roll (1g) which climbed to rank 1 on a +53.7% MoM surge. Mule Fuel Pre-Roll (1g) reached rank 2 on +46.6% MoM, and six of the top ten are Pre-Roll SKUs, concentrating mix toward quick-turn formats; the combined effect is a pivot toward high-velocity Pre-Rolls even as volatility at rank 4 flags exposure to SKU churn. This pattern implies Summa Cannabis is consolidating around a few scale Pre-Roll winners at the top while pruning or repositioning underperforming Pre-Roll variants to stabilize share.
Top Selling Cannabis Brands






Data for this report comes from real-time sales reporting by participating cannabis retailers via their point-of-sale systems, which are linked up with Headset’s business intelligence software. Headset’s data is very reliable, as it comes digitally direct from our partner retailers. However, the potential does exist for misreporting in the instance of duplicates, incorrectly classified products, inaccurate entry of products into point-of-sale systems, or even simple human error at the point of purchase. Thus, there is a slight margin of error to consider. Brands listed on this page are ranked in the top twenty within the market and product category by total retail sales volume.

