.svg)

Sep-2026
Sales
Trend
6-Month
Product Count
SKUs
Avg Price
YoY Sales Change
YoY Price Change


Where to Buy
Redwood is stocked at 24 licensed dispensaries across Nevada and Minnesota, 23 of them in Nevada, with the deepest coverage in Las Vegas, Henderson, North Las Vegas, Jackpot, and Mesquite. Search by ZIP code or city below to find the closest one, or filter by product type if you are after a specific format.
Market Insights Snapshot
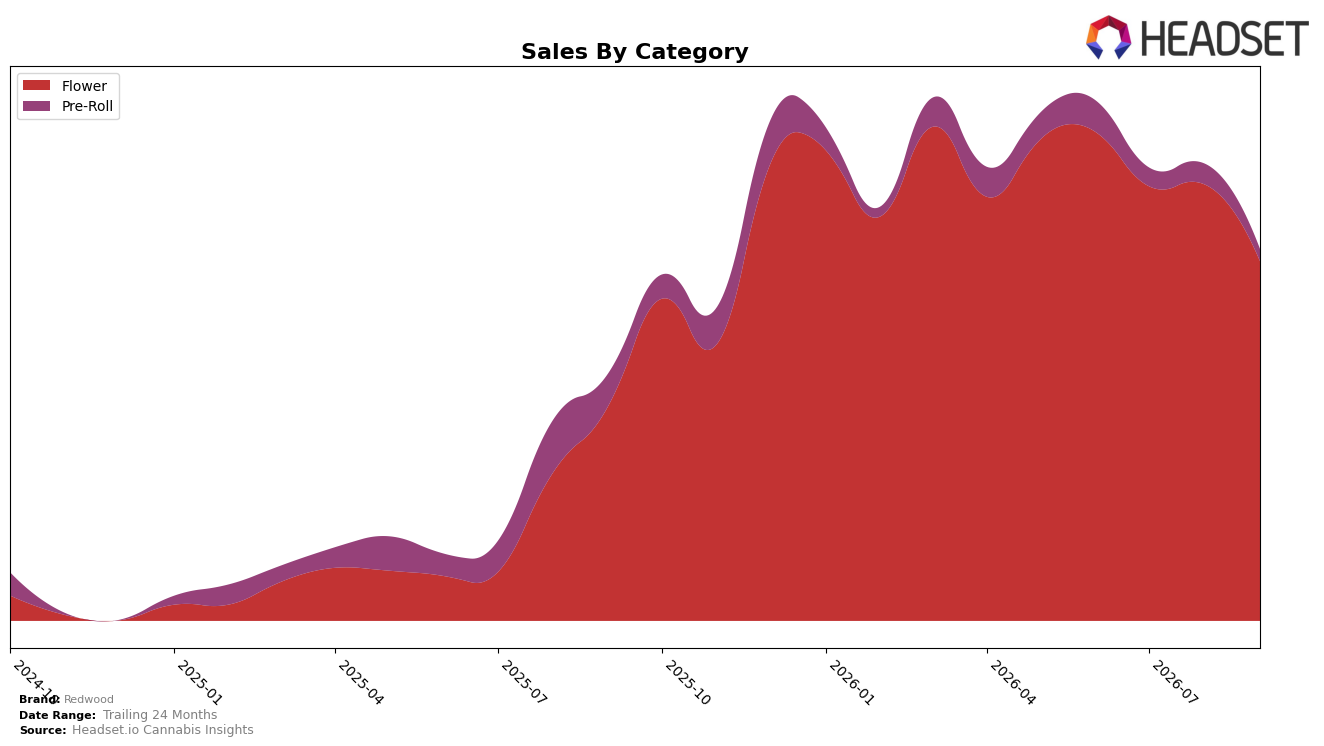
Flower held 96.80% share in September 2026, up 67.52% year over year but down 17.60% month over month, while Pre-Roll slipped to 3.20% share with a 63.22% YoY decline and a 41.97% MoM drop. Overall brand sales rose 50.41% YoY as average price fell 37.12% YoY to $14.53, and within the lead state Nevada Redwood ranked 9 in Flower, indicating volume-led growth despite recent month-over-month pullback. The pattern implies a concentrated bet on Flower that is expanding annual throughput but exposed to short-term volatility as Pre-Roll contribution contracts.
The combination of a 96.80% Flower mix and a 37.12% YoY price decrease suggests Redwood is prioritizing share capture via price-accessible Flower, consistent with a 50.41% YoY sales increase but vulnerable when MoM demand eases by 17.60% in the core category. With Pre-Roll shrinking 41.97% MoM and 63.22% YoY at just 3.20% share, Redwood’s 9th rank in Nevada Flower signals positioning as a volume player dependent on sustained Flower traffic, implying headroom in premiumization or format diversification to stabilize month-to-month swings while protecting the Flower-led rank position.
Competitive Landscape
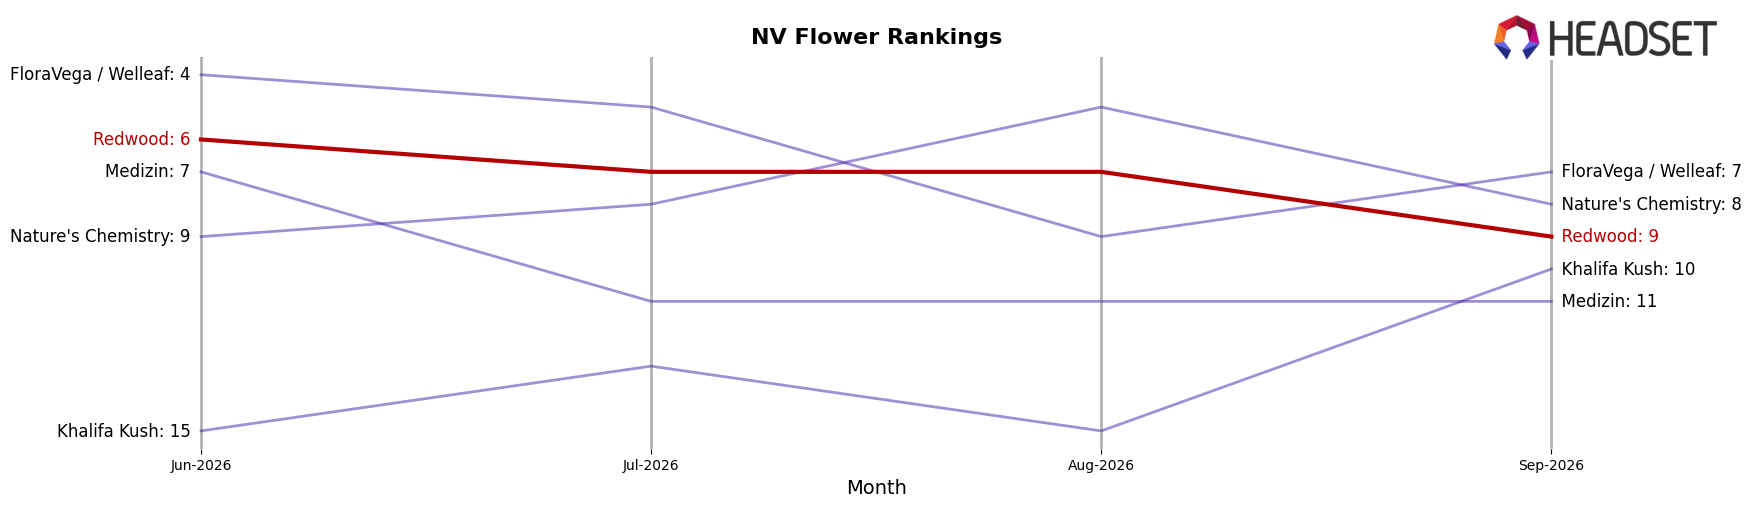
Redwood sits at rank 9 in Nevada Flower for September 2026, improving 7 positions year over year from rank 16, but sliding 3 spots since June 2026 from rank 6, and sitting 4 places below its May 2026 peak at rank 5; meanwhile, RYTHM held rank 1 with year-over-year sales up 19.7%, and STIIIZY maintained rank 2 with 24.2% sales growth, indicating that Redwood’s relative gains versus last year are tempered by recent quarter-on-quarter slippage amid faster-rising leaders. Against the mid-pack, Alternative Medicine Association / AMA advanced from rank 5 to rank 3 with 32.6% sales growth while Neon Moon moved from rank 9 to rank 4 on 82.7% growth, outpacing Redwood’s climb and widening the competitive gap by 5 rank positions versus May 2026; together with Lavi rising from rank 8 to rank 5 on 33.8% growth, this pattern implies Redwood’s trajectory points to mid-tier consolidation unless momentum is recaptured to reverse the 3-position drop since June 2026.
Notable Products
Strawberry Mango Haze (3.5g) set the tone in September 2026 with a 63.96% month-over-month jump to $83,960 and a #1 rank, while Banana Pie (3.5g) plunged 66.46% and fell to #10, indicating sharp divergence within the same portfolio. First Class Funk (3.5g) slid 42.09% at #8 as Sour Diesel (3.5g) inched up 7.17% at #4, and UK Cheese (3.5g) added 5.76% at #6, pointing to selective velocity gains amid attrition at the lower end of the top ten. Eight of the top ten are Flower SKUs and the top three ranks are all 3.5g Flower, which implies Redwood is concentrating demand into a few high-velocity eighths while pruning or deprioritizing lagging variants.
Top Selling Cannabis Brands






Data for this report comes from real-time sales reporting by participating cannabis retailers via their point-of-sale systems, which are linked up with Headset’s business intelligence software. Headset’s data is very reliable, as it comes digitally direct from our partner retailers. However, the potential does exist for misreporting in the instance of duplicates, incorrectly classified products, inaccurate entry of products into point-of-sale systems, or even simple human error at the point of purchase. Thus, there is a slight margin of error to consider. Brands listed on this page are ranked in the top twenty within the market and product category by total retail sales volume.

