Market Insights Snapshot
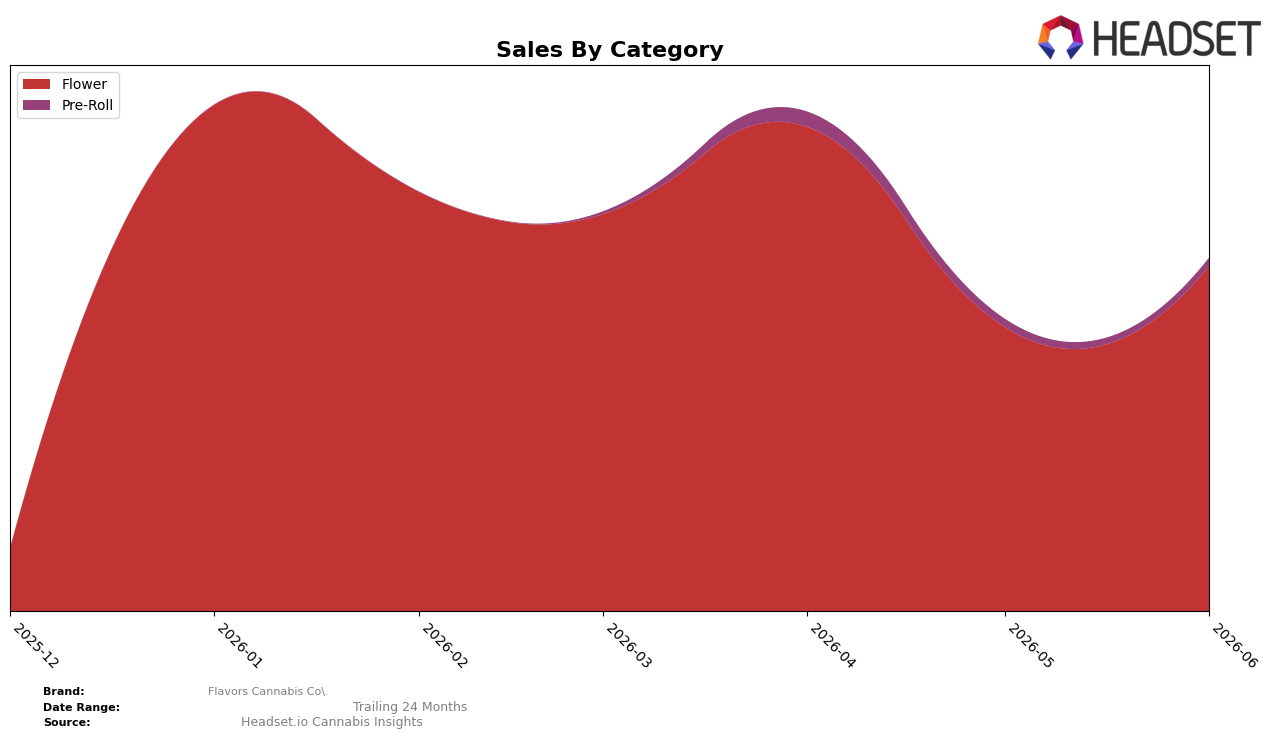
In June 2026, Flavors Cannabis Co. concentrated 97.77% of sales in Flower while Pre-Roll held 2.23%, indicating a two-category footprint with a pronounced skew. Month over month, Flower expanded by 21.77% while Pre-Roll slipped by 1.16%, creating a widening spread between the core and the satellite category. Average price in June 2026 was $48.47, with category-level pricing split between $54.03 in Flower and $8.79 in Pre-Roll, which reinforces a volume-to-value tilt anchored in Flower. With Flower ranked 27th in Arizona, the pattern implies that short-term growth is being driven by a single-cylinder engine, raising concentration risk if category momentum cools.
The mix shift implies positioning anchored in higher-ticket Flower, where a 21.77% month-over-month gain contrasts with a 1.16% month-over-month pullback in Pre-Roll, signaling prioritization of depth over breadth. The 97.77% Flower share versus 2.23% in Pre-Roll suggests brand equity and retail shelf economics are optimized for eighths and larger formats rather than impulse-oriented minis, which can limit trial but may protect average basket size. Given the 27 rank in Arizona Flower, maintaining the current trajectory likely depends on sustaining Flower velocity; absent diversification, even a mid-single-digit decline in Flower could outweigh double-digit percentage gains in the smaller Pre-Roll base.
Competitive Landscape
Flavors Cannabis Co. sits at rank 27 in AZ Flower for June 2026, unchanged from rank 27 in March 2026, with a prior peak at rank 22 in January 2026 marking a 5-position slide since that peak; by contrast, Just Flower is ranked 1 while Brown Bag holds rank 5 after a year-over-year sales change of 72.8%. The competitive gap is widening as The Pharm advanced to rank 4 from rank 5 year over year alongside a 44.1% sales increase, whereas Mohave Cannabis Co. remains at rank 3 despite a -13.9% sales shift; this places Flavors Cannabis Co.’s static rank at 27 against upward mobility in the top five. The pattern implies Flavors Cannabis Co.’s flat three-month trajectory and retreat from its January 2026 peak are signaling share consolidation above it, requiring either mix or distribution changes to arrest rank stagnation.

Notable Products
The steepest decline came from C Kush (3.5g), down 30.7% month over month and sitting at rank 6, while Lemon Cherry Gelato Popcorn (14g) fell 15.6% at rank 7, indicating risk in smaller-size and Lemon Cherry variants as larger bags ascend. Black Cherry Gelato Popcorn (14g) posted the largest MoM gain at 55.8% to rank 4, and White Cherry Gelato Popcorn (14g) rose 31.1% to rank 2, as Super Boof Popcorn (14g) led at rank 1 with a 15.5% lift and approximately $56,646 in June 2026 sales. Eight of the top ten are Flower SKUs, with four of the top seven being 14g Popcorn formats, signaling a tilt toward value-driven larger packs over eighths and non-flower.
Top Selling Cannabis Brands
Data for this report comes from real-time sales reporting by participating cannabis retailers via their point-of-sale systems, which are linked up with Headset’s business intelligence software. Headset’s data is very reliable, as it comes digitally direct from our partner retailers. However, the potential does exist for misreporting in the instance of duplicates, incorrectly classified products, inaccurate entry of products into point-of-sale systems, or even simple human error at the point of purchase. Thus, there is a slight margin of error to consider. Brands listed on this page are ranked in the top twenty within the market and product category by total retail sales volume.

