Market Insights Snapshot
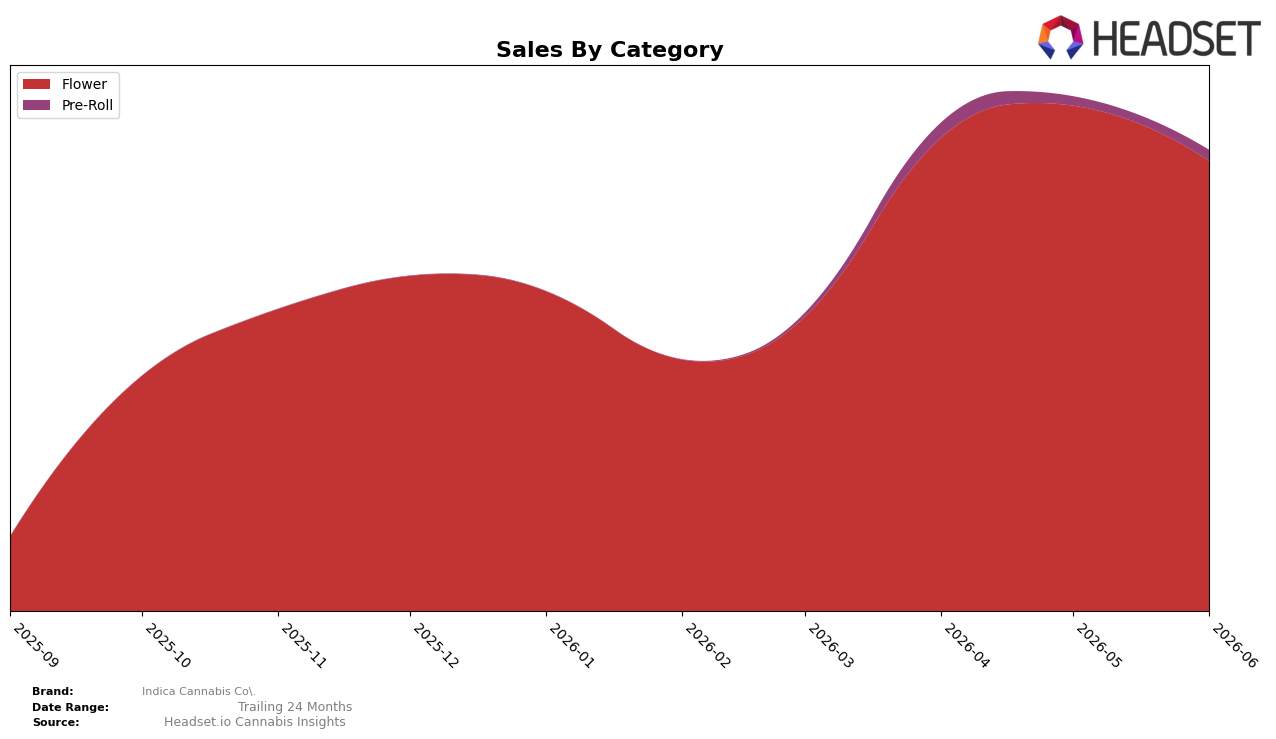
Flower held 97.68% of Indica Cannabis Co.'s June 2026 mix while Pre-Roll accounted for 2.32%, and within the month Flower fell 10.96% MoM as Pre-Roll rose 18.35% MoM. Average price skewed higher in Flower at $54.10 versus lower-ticket Pre-Roll at $8.70, and within Arizona the Flower category placement sat at rank 14, indicating mid-pack traction rather than top-decile placement. The concentration in Flower alongside a month-over-month dip paired with a double-digit Pre-Roll uptick implies a slow pivot toward value-access points without materially changing the portfolio’s heavy reliance on Flower.
With 97.68% of sales tied to Flower and a rank of 14 in Arizona Flower, Indica Cannabis Co. is positioned as a Flower-led brand that is trading some volume into lower-priced formats as Pre-Roll grows 18.35% MoM while the core declines 10.96% MoM. The mix stability at near 98% Flower despite divergent category momentum suggests pricing and assortment in Flower, not category diversification, will be the primary lever for near-term rank movement, and the small but faster-growing 2.32% Pre-Roll slice functions as an entry channel rather than a share-shifting engine.
Competitive Landscape
Indica Cannabis Co. sits at rank 14 in AZ Flower for June 2026, up 6 positions from rank 20 in March 2026, while lacking a year-over-year rank print indicates volatility around its recent peak at rank 13 in May 2026; in contrast, Just Flower holds rank 1 with a 13.0% YoY sales gain and The Pharm advanced from rank 5 to rank 4 alongside a 44.1% YoY increase, tightening the gap above Indica’s mid-teen position. With Brown Bag improving from rank 7 to rank 5 while growing sales 72.8% YoY and Mohave Cannabis Co. holding rank 3 despite a 13.9% YoY sales decline, Indica’s one-month retreat from rank 13 to rank 14 after a three-month climb of 6 ranks signals a stall: the brand is orbiting the top-10 threshold but will likely cede ground to faster-rising peers unless the upward momentum from March 2026 to May 2026 resumes.

Notable Products
Triangle Kush (3.5g) posted the steepest decline in June 2026 at -69.1% MoM while falling to rank 2, contrasted with HS143 Popcorn (14g) rising 15.7% MoM to hold rank 1. Biker Kush (3.5g) also dropped -56.8% MoM at rank 3, while Triangle Kush Popcorn (14g) grew 10.8% MoM at rank 4. With seven of the top ten in Flower and multiple Popcorn 14g SKUs clustered between ranks 1 and 9, the mix implies a tilt toward value-oriented larger formats to stabilize volume as traditional 3.5g units retrench.
Top Selling Cannabis Brands
Data for this report comes from real-time sales reporting by participating cannabis retailers via their point-of-sale systems, which are linked up with Headset’s business intelligence software. Headset’s data is very reliable, as it comes digitally direct from our partner retailers. However, the potential does exist for misreporting in the instance of duplicates, incorrectly classified products, inaccurate entry of products into point-of-sale systems, or even simple human error at the point of purchase. Thus, there is a slight margin of error to consider. Brands listed on this page are ranked in the top twenty within the market and product category by total retail sales volume.

