Market Insights Snapshot
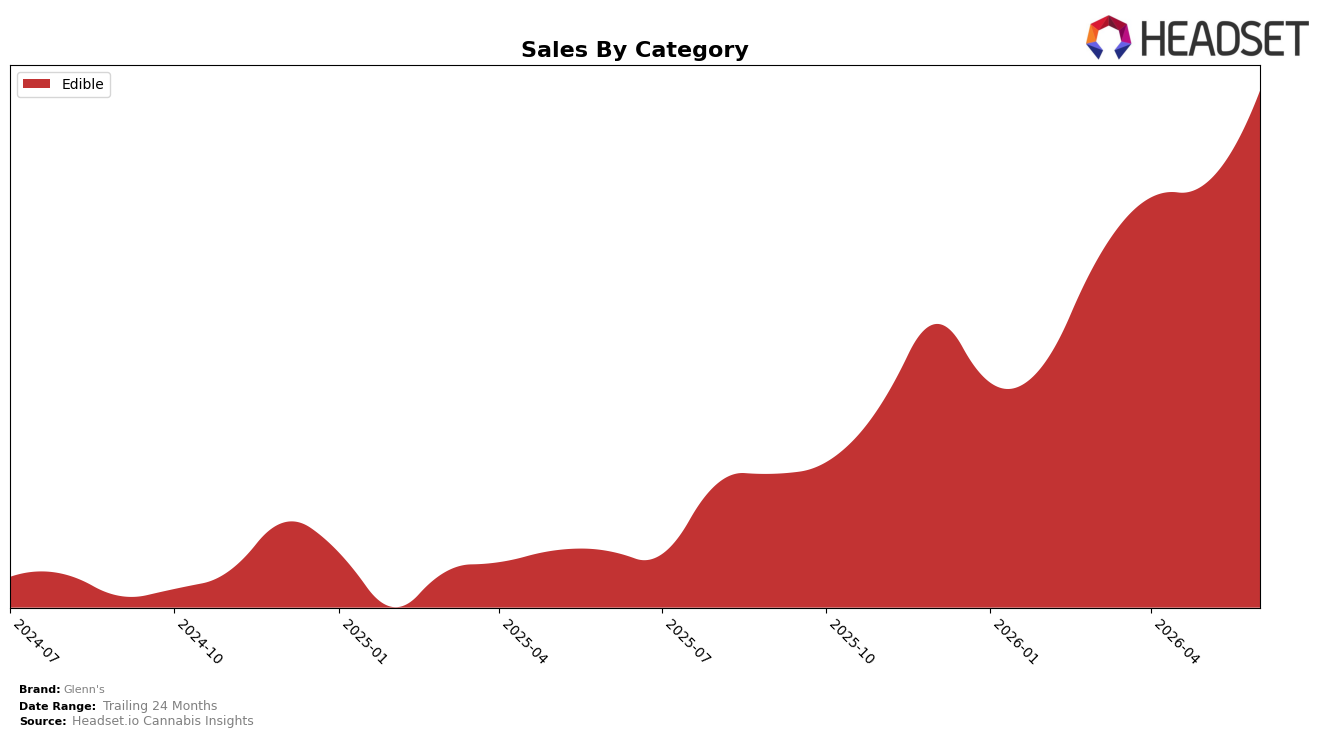
In June 2026, Glenn's operated as a single-category brand with Edible holding 100.0% category share, while Edible sales were up 213.998% year over year and 16.073% month over month. The average price fell 41.224% year over year to $2.05, coinciding with a 16.073% month-over-month sales uptick and a 213.998% annual sales surge, implying that mix-driven growth is entirely concentrated in value-priced Edibles and that price elasticity is fueling volume rather than diversification.
Positionally, Glenn's sat at rank 9 within Edible in Ontario, pairing a 213.998% year-over-year sales rise with a 41.224% price compression, while month-over-month sales expanded 16.073% without any category expansion beyond Edible. This combination—100.0% reliance on Edibles and a rank of 9—implies a value-led, volume-accretive stance that prioritizes depth within Edibles over breadth, with pricing used as the primary lever to climb share rather than entering adjacent categories.
Competitive Landscape
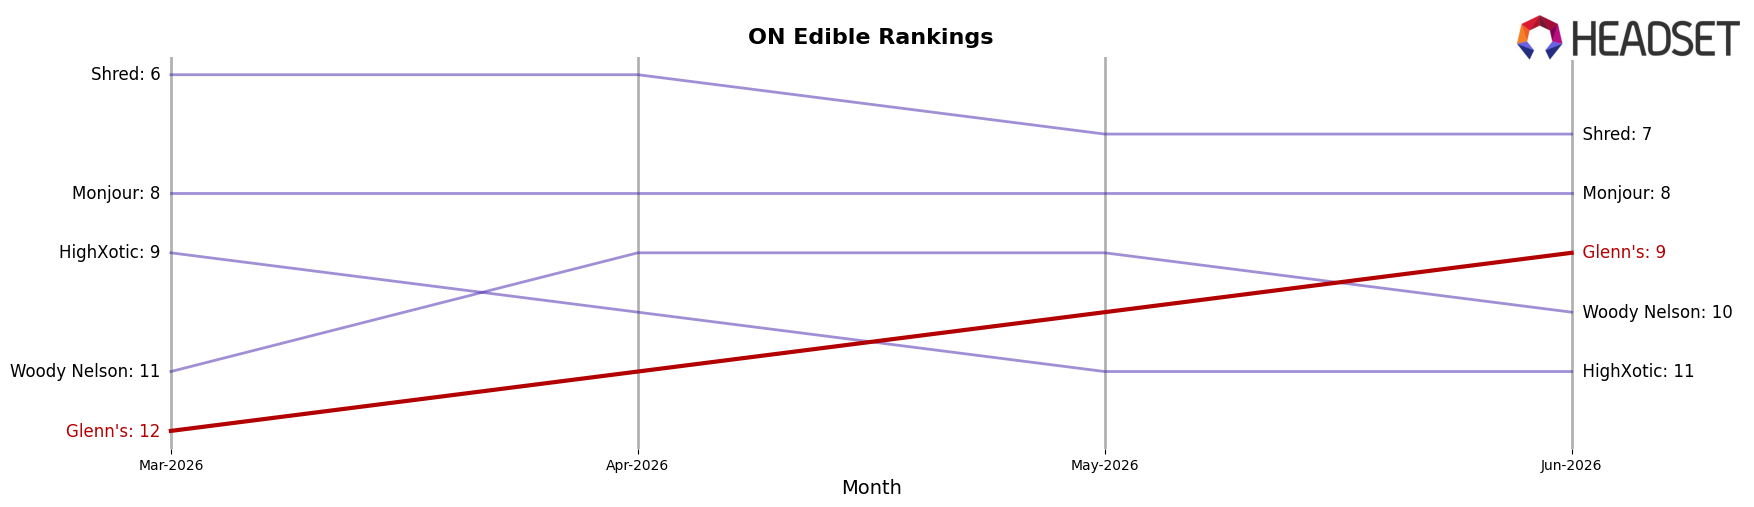
Glenn's sits at rank #9 in ON Edible in June 2026, improving 8 positions year over year from #17 and rising 3 spots since March 2026 from #12, while competitors like Wyld advanced from #4 to #3 with 21.9% YoY sales growth and Olli moved from #7 to #4 alongside 120.7% YoY sales growth. Holding its peak rank at #9 in June 2026 rather than breaking into the top 5, especially against Spinach steady at #1 with 9.9% YoY growth, implies Glenn's trajectory is upward but capped by faster-climbing rivals, signaling that sustaining share gains will require outpacing mid-tier movers rather than only tracking category leaders.
Notable Products
No.23 - Blue Raspberry Cotton Clouds Gummy (10mg) set the tone in June 2026 with a 64.4% month-over-month rise to rank 1, while the steepest pullback hit No.9 True Sativa Resin XL Tropical Smoothie Gummy (10mg) at -27.0% and rank 8. The runner-up, No 15 - Watermelon Distillate Gummy (10mg), advanced 33.3% at rank 2, contrasting with Orange Creamsicle Hash Rosin Gummies 2-Pack (10mg) down 21.9% at rank 6. Eight of the top ten are Edible SKUs from a mix of distillate, resin, and hash rosin formats, and the skew toward fast-rising distillate-led items implies Glenn's is consolidating share around flavor-forward, value-oriented gummies while premium rosin lines face pressure.
Top Selling Cannabis Brands
Data for this report comes from real-time sales reporting by participating cannabis retailers via their point-of-sale systems, which are linked up with Headset’s business intelligence software. Headset’s data is very reliable, as it comes digitally direct from our partner retailers. However, the potential does exist for misreporting in the instance of duplicates, incorrectly classified products, inaccurate entry of products into point-of-sale systems, or even simple human error at the point of purchase. Thus, there is a slight margin of error to consider. Brands listed on this page are ranked in the top twenty within the market and product category by total retail sales volume.

