Jun-2026
Sales
Trend
6-Month
Product Count
SKUs
Avg Price
YoY Sales Change
YoY Price Change
Market Insights Snapshot
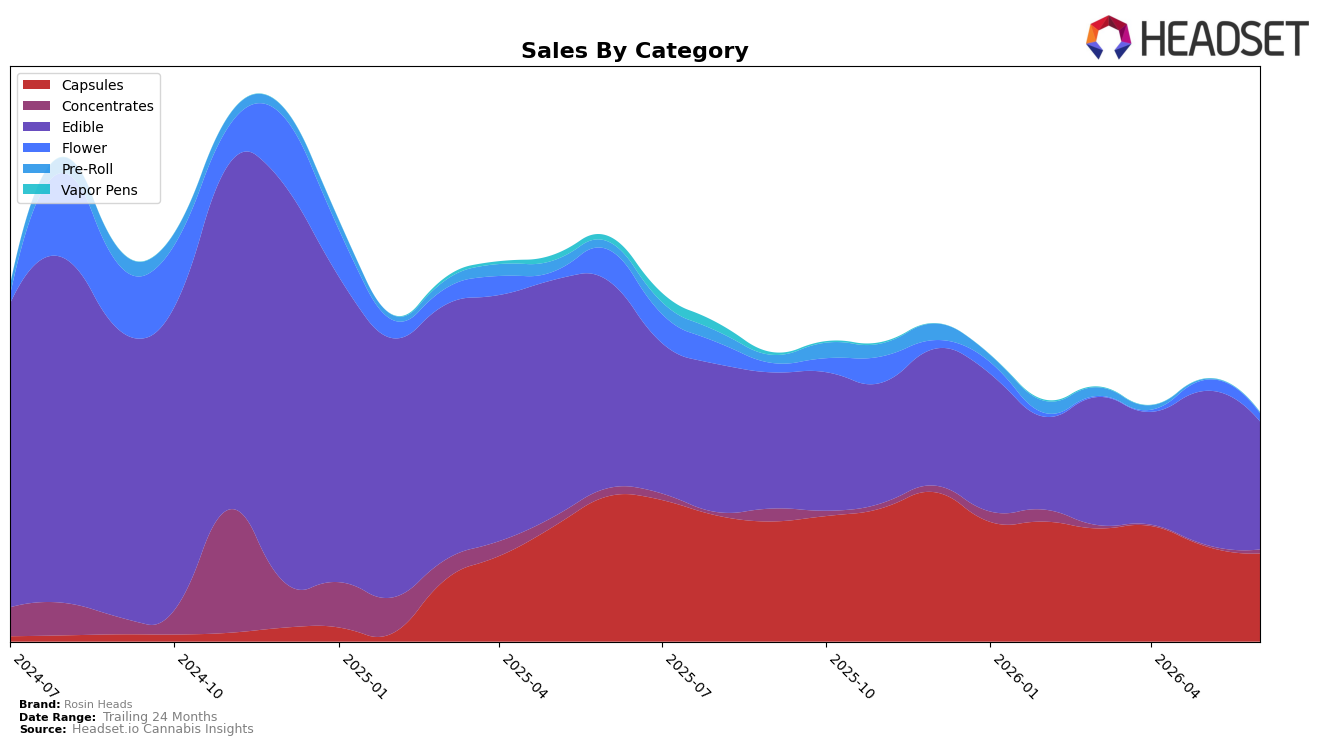
Rosin Heads concentrated 56.08% of June 2026 sales in Edible with a year-over-year decline of 38.35% and a month-over-month drop of 16.62%, while Capsules held 38.59% share with a 39.47% YoY decrease and a 7.94% MoM decline; this mix leaves only 3.47% in Flower, where sales fell 74.33% YoY and 25.47% MoM, and 1.63% in Concentrates, which rose 222.92% MoM despite a 52.01% YoY decline. Pre-Roll shrank to 0.23% share with a 93.10% YoY and 28.09% MoM decline, and Edible’s average price at $18.54 sits far below Capsules at $35.63, while the brand’s overall average price rose 3.54% YoY; taken together with an Ontario Edible rank of 17, the pattern implies the brand is anchored in lower-priced Edible volume while de-emphasizing Flower and Pre-Roll.
The shift shows concentration risk: with 94.67% of sales in Edible and Capsules combined, simultaneous YoY declines of 38.35% and 39.47% compress the base even as Concentrates’ 222.92% MoM spike is too small at 1.63% share to offset the mix. The 16.62% MoM contraction in Edible versus a milder 7.94% MoM dip in Capsules, alongside a 3.54% YoY rise in average price and a 25.47% MoM pullback in Flower, implies a pivot toward higher-ticket Capsules to stabilize revenue per unit while accepting lower breadth in Flower and Pre-Roll.
Competitive Landscape
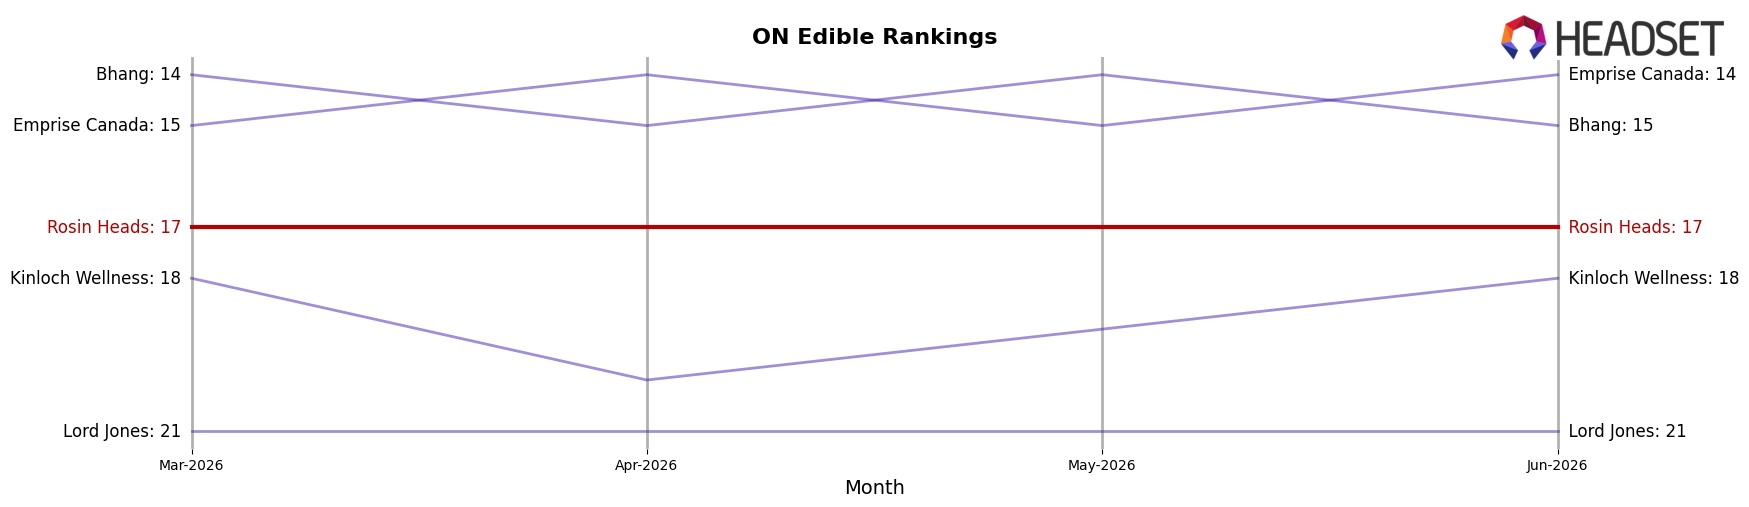
Rosin Heads sits at rank 17 in ON Edible for June 2026, down 2 positions year over year from rank 15, while holding flat quarter over quarter at rank 17 and still 4 places below its December 2024 peak at rank 13; in contrast, Wyld climbed year over year from rank 4 to rank 3 alongside a 21.9% sales increase, and Olli moved up from rank 7 to rank 4 with 120.7% YoY sales growth, indicating that Rosin Heads’ stagnant rank over the last three months and two-position YoY slippage signal share leakage to faster-rising rivals.
Notable Products
Caramel Coffee Crunch Chocolate (10mg) posted the standout move in June 2026 with a 305.3% month-over-month surge to rank 9, while Hash Rosin Drops Mints 50-Pack (250mg) held rank 1 despite a -17.1% decline, indicating volatility at the tail alongside softening at the top. Hash Rosin Caramel Stix Milk Chocolate (10mg) fell -47.1% at rank 3 as Indica Hash Rosin Drops Tablets 25-Pack (250mg) climbed 42.3% to rank 7, showing Capsules are gaining share as certain Edibles contract. Four of the top ten are Edible SKUs, but the upward movement concentrates in Capsules while Edibles split between growth outliers and double-digit pullbacks. This mix implies Rosin Heads is pivoting toward dose-controlled formats and selective chocolate novelty plays, reallocating emphasis away from mature Edible leaders.
Top Selling Cannabis Brands
Data for this report comes from real-time sales reporting by participating cannabis retailers via their point-of-sale systems, which are linked up with Headset’s business intelligence software. Headset’s data is very reliable, as it comes digitally direct from our partner retailers. However, the potential does exist for misreporting in the instance of duplicates, incorrectly classified products, inaccurate entry of products into point-of-sale systems, or even simple human error at the point of purchase. Thus, there is a slight margin of error to consider. Brands listed on this page are ranked in the top twenty within the market and product category by total retail sales volume.

