.svg)

Aug-2026
Sales
Trend
6-Month
Product Count
SKUs
Avg Price
YoY Sales Change
YoY Price Change


Market Insights Snapshot
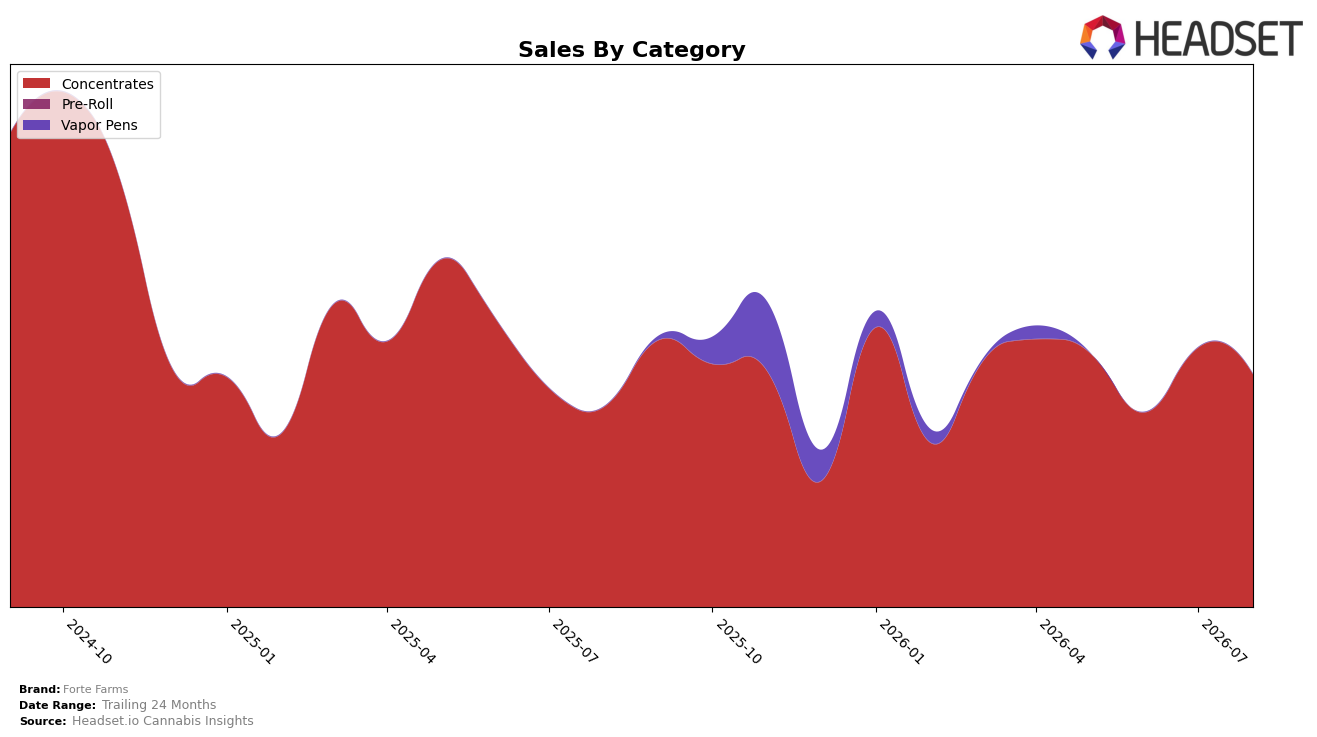
In August 2026, Forte Farms operated as a single-category brand with Concentrates at 100.0% of sales, posting year-over-year growth of 16.32% but month-over-month decline of 10.29%. Brand-level sales rose 16.27% year over year while average price increased 2.71%, indicating volume growth outpacing price, yet the 24-month sales change of -51.15% points to a compressed long-term base. The brand held rank 40 in Concentrates in Oregon, suggesting stable mid-tier placement despite August’s sequential dip. The pattern implies a concentrated bet on Concentrates that is working on a yearly basis but is vulnerable to intra-quarter volatility and longer-horizon erosion.
The mix concentration at 100.0% in Concentrates, combined with a 16.27% year-over-year brand sales lift and a 10.29% month-over-month pullback, indicates exposure to seasonal or launch-cycle swings rather than diversified smoothing across categories. With average price up 2.71% while rank sits at 40 in Oregon, Forte Farms is trading slightly higher without rank acceleration, implying that gains are being driven by unit throughput within a narrow niche rather than premium-led share capture. The pattern implies that maintaining August-level pricing while expanding beyond a single category, or widening SKU breadth within Concentrates to stabilize month-over-month softness, would be the lever to convert yearly growth into sustained rank improvement.
Competitive Landscape
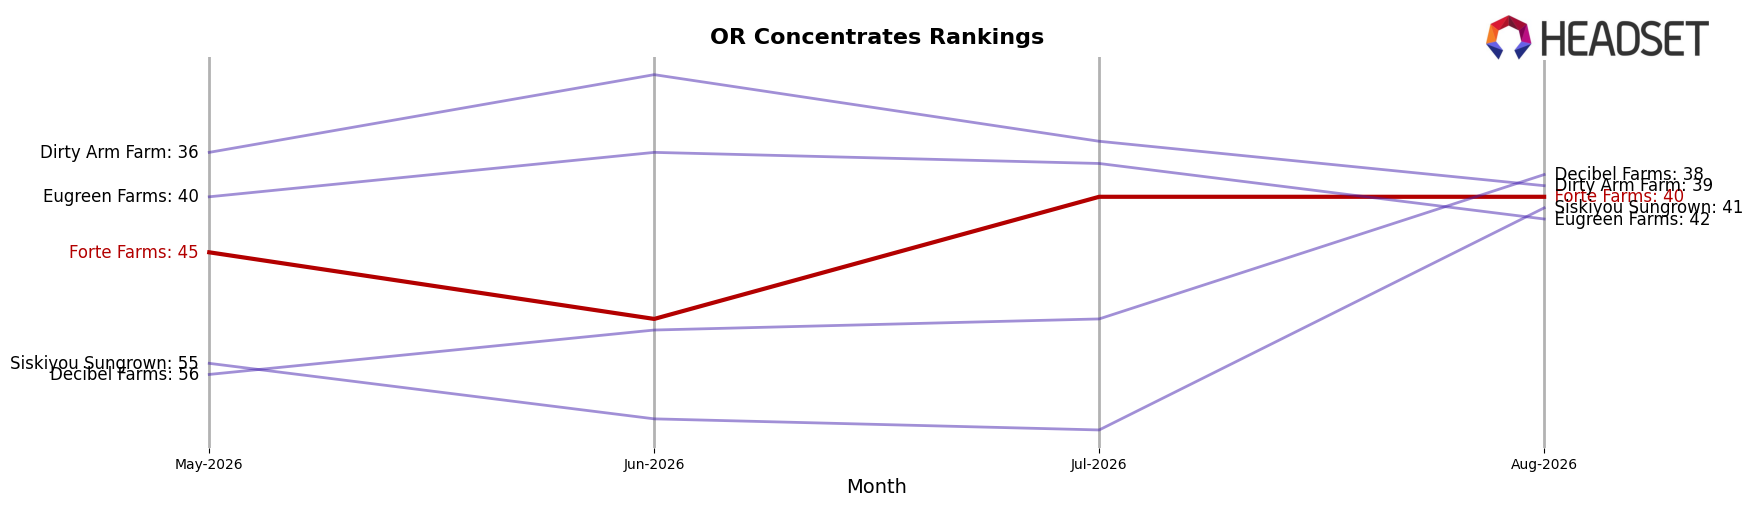
Forte Farms sits at rank #40 in OR Concentrates in August 2026, improving 5 positions from #45 year over year, yet remaining 15 spots below its peak of #25 from October 2024. The top of the leaderboard is consolidating: Altered Alchemy holds #1 with 18.36% year-over-year sales growth while Oregrown climbed from #3 to #2 on 45.92% growth, and Red Eye Extracts (OR) slipped from #2 to #3 with a 22.11% decline; by contrast, Forte Farms only narrowed its rank gap by 11.1% relative to its prior #45 position and remains 60.0% below its historical best rank in ordinal terms. With White Label Extracts (OR) nudging up from #5 to #4 despite a 2.23% sales dip and Buddies rising from #7 to #5 on 8.79% growth, the directional pattern implies Forte Farms’ modest rank recovery is outpaced by faster-moving rivals, signaling a trajectory consistent with mid-tier stabilization rather than a return to top-25 contention without a change in velocity.
Notable Products
The steepest decline in August 2026 came from 8-Bit Applez Cured Hash (2g), down 48.16% while slipping outside the top five as ranks 1 and 2 were held by Forbidden Rntz #11 Live Rosin (2g) and Garlicot Bubblegum #11 Cured Hash (2g). Banana Bottom Jeans Live Rosin (2g) fell 36.51% yet held rank 3, whereas Forbidden Rntz #11 Live Rosin (2g) in rank 1 inched up 5.34% against a flat 0.74% move for Noize Complaint Live Rosin (2g) at a tied rank 9. Nine of the top ten are Concentrates SKUs, with Live Rosin variants spanning ranks 1, 3, 7, 8, and 9, and Cougar Bait #16 Live Rosin (1g) sliding 19.59% at rank 9 versus Garlicot Bubblegum Cured Hash (1g) rising 25.09% at rank 5. The pattern implies Forte Farms is consolidating around a Live Rosin-led ladder while pruning weaker cured-hash lines, with volatility concentrated in mid-tier SKUs rather than the flagship at rank 1.
Top Selling Cannabis Brands






Data for this report comes from real-time sales reporting by participating cannabis retailers via their point-of-sale systems, which are linked up with Headset’s business intelligence software. Headset’s data is very reliable, as it comes digitally direct from our partner retailers. However, the potential does exist for misreporting in the instance of duplicates, incorrectly classified products, inaccurate entry of products into point-of-sale systems, or even simple human error at the point of purchase. Thus, there is a slight margin of error to consider. Brands listed on this page are ranked in the top twenty within the market and product category by total retail sales volume.

